
Prior to President Biden taking office last January, there was hope on the part of some and a concern on the part of others that the hard line that the U.S. had taken with China with respect to trade and investment would be eased. In the eight months since then, an easing of the hard line has not happened. In fact, it has been the opposite and that has implications for U.S./China trade and investment over the next two years.
An example of this is the March 2021 meeting of top diplomats from both countries in Anchorage. The meeting began with a rare harsh exchange and did not get better from there. There are new U.S. diplomatic initiatives with Japan, Australia and India to develop strategies to counter China’s increasingly assertive behavior in the region. On June 13, 2021, the G7, which includes the U.S., met in Cornwall England and issued a 25-page joint statement1 covering issues of public health, economic recovery, free and fair trade, climate change and the environment, and tax policy. In the statement the G7 said they would continue with collective approaches to challenge China’s non-market policies and practices. In response, China denounced the G7 statement and urged the G7 countries to not interfere in China’s internal affairs and harm China’s interests.
Separately, Beijing enacted a law to counter the U.S. and EU sanctions over trade, technology, Hong Kong, and Xinjiang. This law is aimed at individuals and entities involved in making or implementing sanctions against Chinese citizens or entities. Among the retaliatory actions are denied entry into or expulsion from China, seizure or freezing of assets in China and restrictions on doing business in China.
Unrelated to the direct interaction between the two countries is China’s initiative to reign in the power of private enterprise. Actions against Ant Group and Evergrande are illustrative of broader actions in the technology and real estate sectors. These include restricting access to foreign capital, increased sharing of private information with Beijing, and aligning domestic and foreign companies’ strategic planning with the current 14th Five-Year Plan. Each will serve to increase the risk and therefore reduce the amount of cross-border investment.
Within the context of this deterioration in economic relations, we will discuss in the following sections the current situation and prospects for international trade, the U.S. economy, and the Chinese economy. The implication of the current data and the trend in internal and external economic forces will be for a slower if not reversal of the trend in goods traded with the U.S., a decrease in foreign direct investment, and a considerably slower growing Chinese economy coming out of the 2020 recession.
Figure 1 shows the percentage change of U.S. merchandise imports since 2018 for selected regions and countries. We use the first six months of import data and extrapolate2 the second half of 2021 to estimate annual data for 2021. In the first half of 2021, the U.S. imported 8% more goods by value than in the first half of 2018. This increase is reflective of the fact that U.S. real GDP has now surpassed its pre-pandemic peak. The origin composition of these imports shows some notable changes over the past three years, the span of the U.S./China trade war. Although U.S. imports from China increased during the first six months of 2021 to a total of $230 billion, compared to $181 billion in 2020 and $218 billion in 2019, it is still lower than the $250 billion in 2018. Moreover, the $230 billion in imports is from a U.S. economy that is 10.2% larger than it was in 2018.
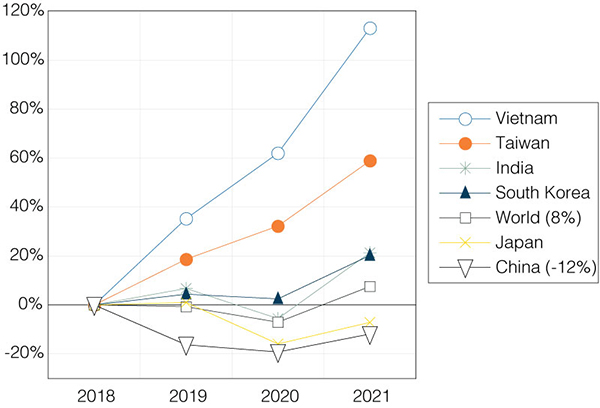
One of the consequences of the deterioration of economic relations between the two countries is a shift in U.S. imports to Vietnam and Taiwan, where import growth by value since 2018 increased by 113% and 59% respectively. In fact, U.S. imports from the Indo-Pacific region (except for China and Japan) have increased over the past three years because of a reallocation of global supply chains. As we discussed in previous reports in this series, the U.S./China decoupling on trade is ongoing, but it is expensive and will be an incremental and lengthy process.
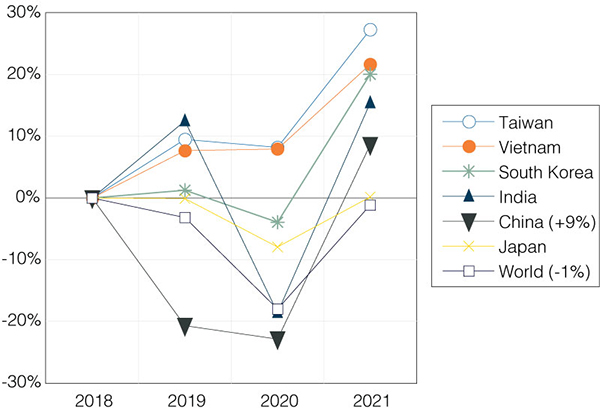
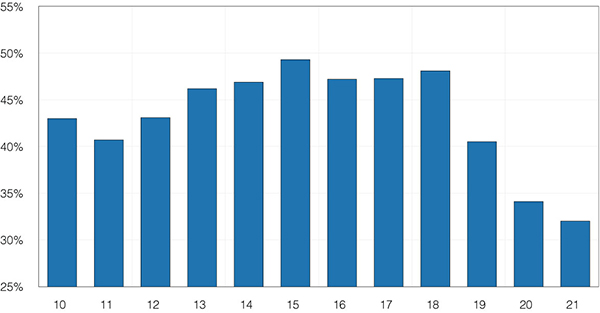
Figure 2 shows the percentage change of U.S. merchandise exports since 2018. U.S. exports to China increased dramatically in 2021, 9% higher than in 2018. With less dependence of imports from China and more exports to China from the U.S., it is good news for both countries that the source of the U.S. trade deficit from China has been declining from 48% in 2018 to 32% in 2021 (Figure 3). Nevertheless, even though there was an increase in exports to China, the amount was far lower than what China committed to in the U.S./China Phase I trade deal. The Peterson Institute3 estimated that as of June 2021, U.S. exports to China reached only 64% of the deal’s target number. Part, though not all, of the difference in U.S. exports is explained by the lack of Boeing Max 737 exports to China. This is expected to pick up as soon as there is CAAC re-certification of the aircraft.
The rapid U.S. recovery over the past two quarters—GDP growth of 6.3% in Q1 and 6.6% in Q2, resulted in U.S. GDP surpassing its pre-pandemic level. Nevertheless, the pandemic still weighs heavily on the U.S. economy. Rising vaccination rates in America helped significantly reduce the COVID-19 case and death rates from February to June (Figure 4), but the slowdown of vaccination afterwards and the spread of the Delta variant have caused a resurgence of confirmed cases and deaths. The recent wave of the pandemic cannot help but slow the growth of the U.S. economy over the coming six months.
Though the recent wave of the pandemic is severe, with case and mortality rates hitting November 2020 levels (Figure 4), the public health and economic policy reactions are different now. Many schools, restaurants and stores are remaining open this time. As a result, economic activities have not yet slumped significantly. However, a continuation of the pandemic surge, particularly in parts of the U.S. where it is most severe, could change this with consumers staying home rather than risking being infected.
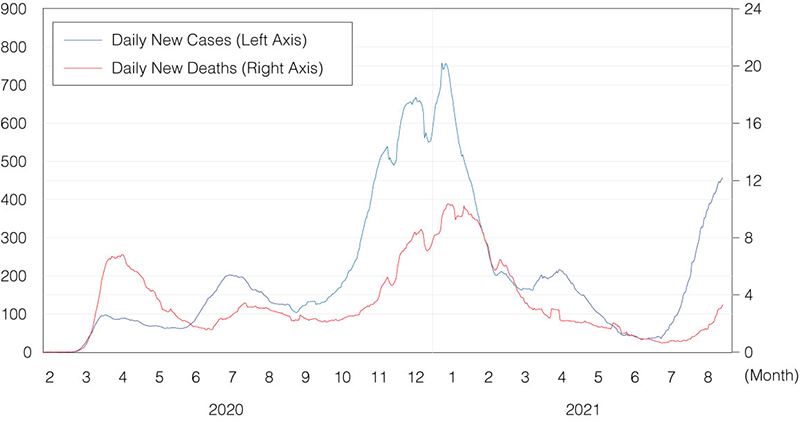
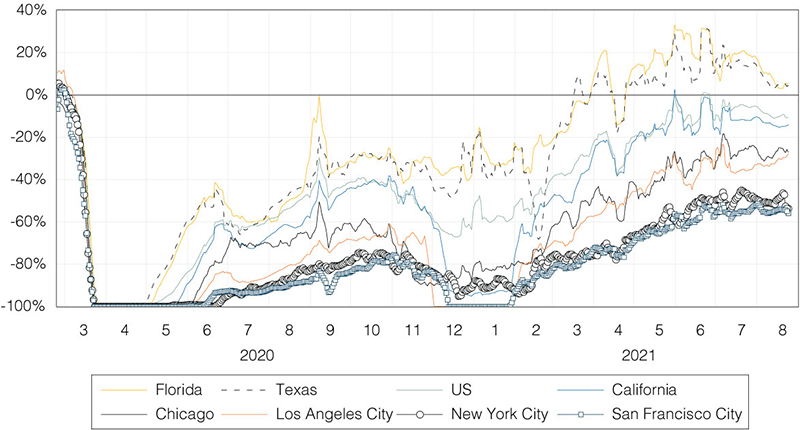
Figure 5 shows the percentage change of restaurant customers compared to the same week just prior to the pandemic. U.S. dining in August is 10% below the pre-pandemic level (green line), and is much better than the 50% below experienced in November 2020. There have been some deteriorations since the beginning of the current surge; with the absence of political will to impose similar stringent public health policies as in 2020, a return to 2020 restaurant visit levels is not likely in the near future.
In short, the U.S. economic expansion is less likely to be derailed with the current COVID-19 surge, but a slowdown from the 6%+ growth rates is more likely.
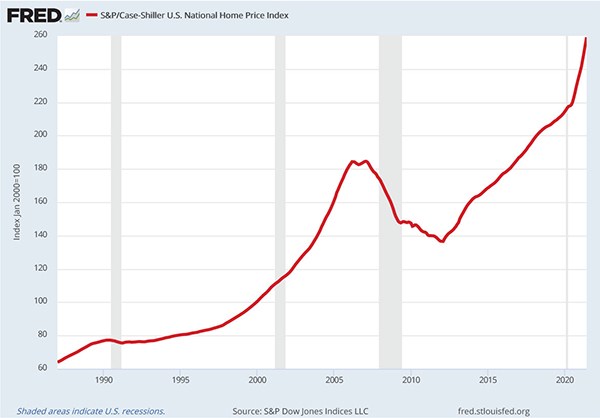
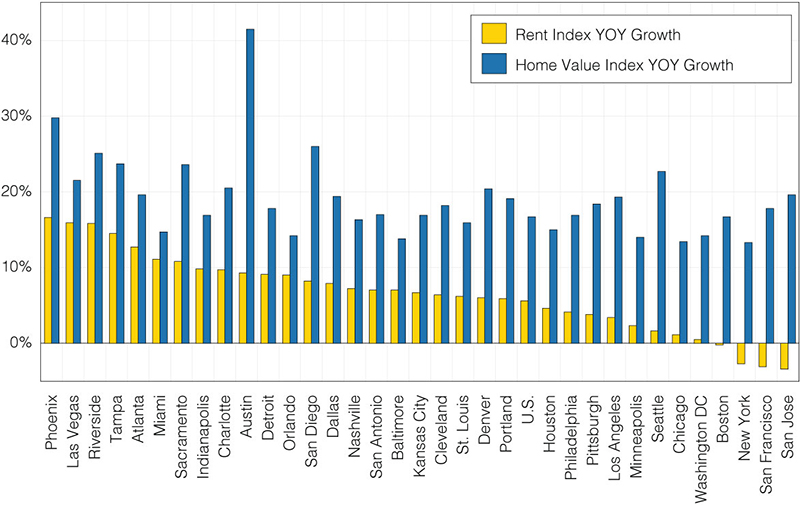
An important component of U.S. economic growth is residential construction and housing markets which continue to be hot. The S&P/Case-Shiller U.S. national home price index, for example, shot up after the recession of 2020 (Figure 6). The June 2021 index was 18.6% higher than one year earlier. This increase was even higher than the peak increase of 14% during the 2005 housing bubble. Figure 7 shows the growth rates for major metropolitan statistical areas of the Zillow mid-range housing value index (blue bars) and the Zillow rental rate index (yellow bars) from July 2020 to July 2021. All metros have double-digit home price growth rates over the past year. Rental rates are also rising, although in the most expensive metros (San Jose, San Francisco, and New York) rates were still lower than the previous year.
In summary, we forecast the U.S. economy will continue with solid growth. But with the Delta variant and resurging cases and deaths, the pace of growth will slow down. U.S. housing markets are forecast to remain upbeat given the historical low mortgage rates and a chronic undersupply of housing. The Fed’s coming tapering should cool down skyrocketing asset price growth in the coming year.
In additional to tariffs, U.S./China tensions, and the disruptive global pandemic, the Chinese economy has been facing internal challenges over the past year. China’s real GDP non-annualized quarter-to-quarter growth rates were 0.4% in 2021 Q1 and 1.3% in 2021 Q2. These are less than the U.S.’s 1.5% and 1.6% respectively. This departure from a very fast-growing Chinese economy was foretold. In the 13th Five-Year Plan which concluded at the end of 2020, emphasis was placed on expanding the services sector and domestic consumption and reducing the reliance on export driven growth. The 14th Five-Year Plan, formally enacted March 2021, establishes a framework for increased emphasis on economic development in the Northeast and in rural China. In addition, it emphasizes vertical deepening of supply chains and protection of new Chinese enterprises. Large sectoral reallocations of resources such as those contemplated in the 13th and 14th Five-Year Plans are associated with slowing growth as firms adjust to the new economic reality. This is particularly true of state-owned enterprises that respond to a different, more bureaucratic set of incentives. Seen in this light, Beijing’s reaction to external forces, particularly the deterioration of relations with the U.S. is much more understandable and leads to the conclusion that slowing growth and the headwinds described in this section will not put as much pressure on Beijing to change direction in the next few years.
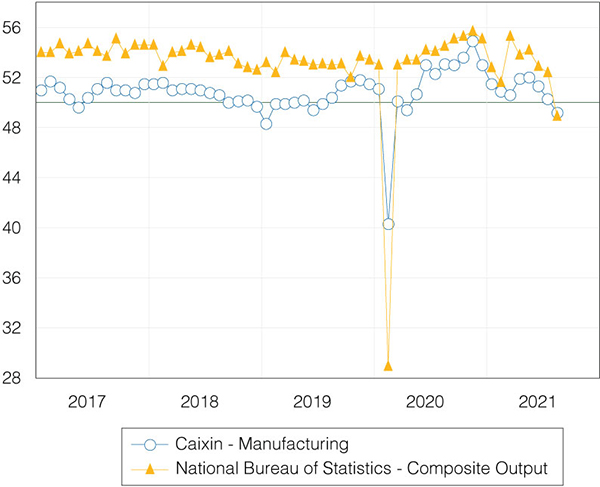
Figure 8 shows two major PMI indices for China. For each index, a value above 50 means growth and below 50 means contraction. The Caixin PMI manufacturing index dropped to 49.2 in August, the first time since April 2020 (blue line). The Chinese official NBS PMI composite index, which includes the manufacturing, construction, and service sectors declined to 48.9 in August (red line). With the exception of February 2020, this is the lowest level over the past five years.
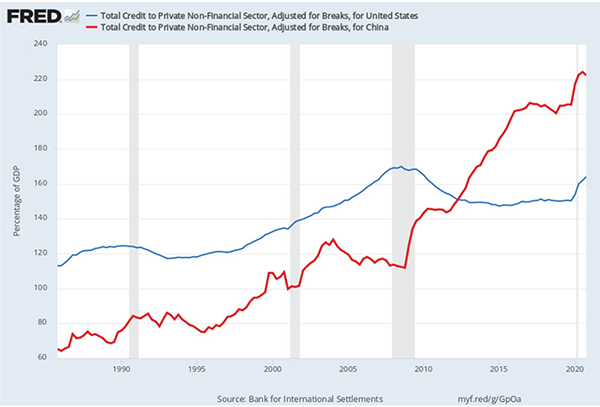
Debt presents another headwind that will make it more difficult for China to return to its previous high growth economy. Among the headwinds China faces is the level of private debt. Figure 9 shows the leverage for the U.S. and China measured by the credit to GDP ratio. China surpassed the U.S. in 2012 and is now at 222% of GDP compared to the U.S.’s 164%. The long-lasting high growth/leverage/debt problem in China has been aggravated by the pandemic, and with more restrictions on the financial sector being put into place, will become more and more unsustainable. The downfall of large companies such as Anbang Insurance, HNA Group, Tsinghua Unigroup, and Evergrande is a vivid example of the difficulty highly leveraged Chinese firms are apt to encounter in the coming years.
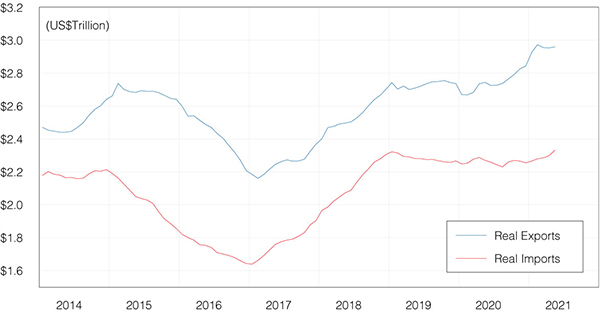
Despite the aforementioned slow decoupling of U.S./China trade, China still plays a crucial role in the global supply chains. Figure 10 shows a 12-month moving average of China’s total value of exports and imports from the world, adjusted for inflation by China’s producer price index.4 Though Beijing’s policy is to pivot towards domestic consumption, the resilient growth over the past year suggests that international trade remains a very important pillar of the Chinese economy.
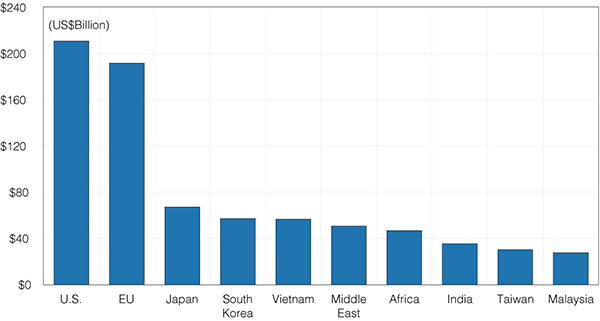
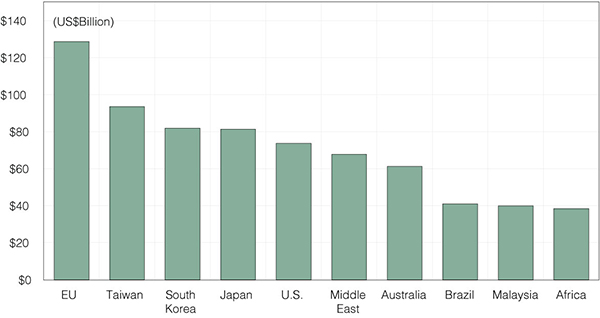
The origin and destination for Chinese merchandise trade are with the usual subjects. Consumer goods and semi-finished inputs to manufacturing are heading out to advanced economies and capital goods and raw materials are headed in. Figure 11 shows the top 10 destinations for China’s exports. The U.S. and the EU remain the top destinations, accounting for approximately one third of China’s total exports. Figure 12 shows the origin of China’s imports by value. The top five partners are EU, Taiwan, South Korea, Japan, and the U.S. They mostly export advanced components to China for further process or assembly. With the resumption of U.S. exports of aircraft later this year, the U.S. volume of exports is expected to increase significantly. The balance of the largest trading partners: Middle Eastern countries, Australia, Brazil, Malaysia, and African countries, are exporting energy, agriculture and raw materials to China.
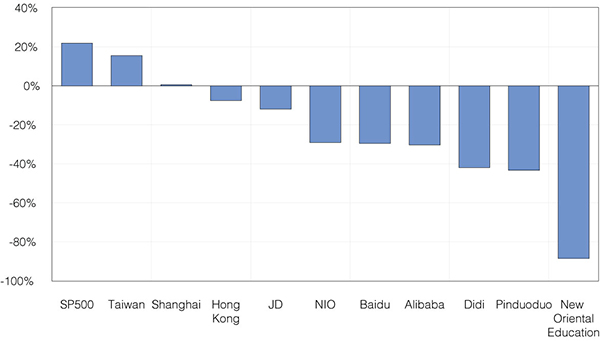
Since late 2020, the Beijing government has been tightening its control on Chinese technology and internet giants. An early indication was the suspension of Ant Group’s IPO in November 2020. Next was a crackdown on Didi Global (ridesharing service) after its IPO on the New York Stock Exchange (NYSE) in July 2021. In addition, Alibaba (e-commerce), Tencent (internet conglomerate), Baidu (search engine), JD.com (e-commerce), Meituan (food delivery), and the educational, entertainment, and online gaming industries faced a series of government reviews, fines, intervention, and restrictions. The direct result is value destruction and decreased flexibility. Figure 13 shows the returns on the U.S. S&P 500 stocks and major stock markets in the Greater China region, and of main Chinese company equities listed on the NYSE or NASDAQ from January to August 2021. While the U.S. S&P 500 had 20% YTD returns, most Chinese companies listed in the U.S. suffered losses from 10% to 90%. The weak performance of the China and Hong Kong stock markets foretells a weak Chinese economy in the coming years.
Clearly, U.S./China economic relations have not improved this year, and if anything, they have become worse since our last report. In response to China’s actions with respect to Didi, the U.S. SEC announced that they will not allow Chinese companies to raise money in the U.S. unless they fully explain their legal structures and disclose the risk of Beijing interfering in their business. The decoupling in finance and capital between the U.S. and China is now moving faster than the decoupling of merchandise trade. Doing business and investing in China or Chinese stocks by Americans and by Chinese in the U.S. are getting riskier. Even some long-time China optimists5 on Wall Street are now worried about China’s outlook as Beijing increases its control on the private sector. With China facing many uncertainties and a private sector in flux, our outlook for the Chinese economy is that it will move from a previous fast growth trajectory to a slower one.
With rising infections due to the Delta variant, the U.S. economy will grow at a slower pace but will still be positive in the next year. Nevertheless, the U.S. is expected to have robust economic growth relative to China and the rest of the world. This would ordinarily be a boon to U.S./China trade and investment, but for the reasons outlined above, it is not expected to be so. Indeed, the international beneficiaries of the growth in the U.S. are more likely to be Canada, Mexico and South and South-East Asia, a dramatic change from the period 1990-2019.
In the U.S.-China 2021 Economic Report, sponsored by Cathay Bank, UCLA Anderson Forecast provides its view of economic analysis and perspective on the current and future outlook relating to the two largest economies in the world — the United States and China.
UCLA Anderson Forecast has been the leading independent economic forecast of both the U.S. and California economies for over 65 years. The annual report and periodic columns focus on current topics affecting investment flows and associated economic events between China and the United States.
This report includes forecasts, projections and other predictive statements that represent UCLA Anderson Forecast’s economic analysis and perspective on the current state and future outlook of the economies of The United States and China based on then available information. These forecasts take into account industry trends and other factors, and they involve risks, variables and uncertainties. This information is given in summary form and does not purport to be complete. Information contained in this report should not be considered advice or recommendation for a particular course of action and does not take into account any particular business objectives, financial situation or needs.
Readers are cautioned not to place undue reliance on the forward-looking statements. UCLA Anderson Forecast does not undertake any obligation to publicly release the result of any revisions to these forward-looking statements after the date of this report. While due care has been used in the preparation of the forecast information, actual results may vary in a materially positive or negative way. Forecasts and hypothetical examples are subject to uncertainty and contingencies beyond the control of UCLA Anderson Forecast.
Jerry Nickelsburg joined the UCLA’s Anderson School of Management and The Anderson Forecast in 2006. Since 2017 he has been the Director of The Anderson Forecast. He teaches economics in the MBA program with a focus on Business Forecasting and on Asian economies. He has a Ph.D. in economics from the University of Minnesota and studied at The Virginia Military Institute and George Washington University. He is widely published and cited on issues related to economics and public policy.
William Yu joined the UCLA Anderson Forecast in 2011 as an economist. At Forecast he focuses on the economic modeling, forecasting and Los Angeles economy. He also conducts research and forecast on China’s economy, and its relationship with the US economy. His research interests include a wide range of economic and financial issues, such as time series econometrics, data analytics, stock, bond, real estate, and commodity price dynamics, human capital, and innovation.

