
| Download this report | |
| Watch the seminar video in English |
The world economy is now in its second year of economic shocks as it adjusts to the new 21st century economic landscape. Last year, 2025, was one of tariff shocks and additional tariff change activity is expected to continue. This year, 2026, is becoming one of energy and commodity shocks that are further changing the U.S., Chinese, and world economy. In January, the U.S. military operation that removed Venezuela’s president shifted oil sales away from China and Cuba. In February, the U.S. launched Operation Epic Fury, targeting Iran’s leadership and military infrastructure to cripple its nuclear weapons capability. As a consequence, petroleum, naphtha, and natural gas supplies in the world market have decreased and the prices for these critical components of manufacturing, transportation, and agriculture have now surged. Moreover, there are continuing risks to tankers transiting the Strait of Hormuz. It is difficult to predict how the conflict with Iran will end or when traffic through the Strait of Hormuz will return to normal. By the time readers see this report, it is possible that the conflict may already be over. Nevertheless, the impact on commodity prices will persist for some time after hostilities cease. In this report, we begin by assessing the scale of the disruption to global oil supply chains and then turn to the economic outlooks for both the U.S. and China.
In spite of this disruption in supply chains, U.S.-China economic relations appear to be shifting toward a cautious pragmatism. Although Venezuela and Iran both had close ties to Beijing, China has been relatively restrained in responding to recent U.S. actions, suggesting that it wants to avoid a broader confrontation with Washington. That restraint likely reflects China’s weak domestic economy and its continued exposure to U.S. pressure on trade and technology. Recent reporting indicates that both sides still want to maintain high-level engagement despite persistent strategic distrust. In that context, President Trump is scheduled to visit Beijing on May 14 for a two day summit with President Xi, underscoring both sides’ interest in preserving a degree of stability even amid deep structural tensions. For now, both countries appear to be buying time: China to strengthen its independence in AI and semiconductors, and the U.S. to de-risk and build more secure supply chains in rare earths and other critical inputs. This is likely not reconciliation but rather a short-term stabilization within a long-term strategic competition and rivalry.
In 2025, about 20.9 million barrels per day (mb/d) of crude oil and petroleum liquids passed through the Strait of Hormuz, accounting for roughly 20% of global oil supply of 104.4 mb/d. After the conflict began, only about 10% of the usual number of ships passed through the strait each day, with that fewer than 2 mb/d still transiting. Fortunately, the UAE has a pipeline that bypasses the strait and runs directly to the Gulf of Oman, with a capacity of about 1.5 mb/d. Saudi Arabia also has the East-West Pipeline to Yanbu on the Red Sea. News reports indicate that roughly 5 mb/d has been rerouted through the Red Sea, equal to about 80% of the roughly 6 mb/d that Saudi Arabia normally ships through Hormuz. Even so, the net decline in oil supply remains around 12 mb/d. With the U.S. blockade of Hormuz beginning on April 13, the daily supply shortfall from the Gulf States remained the same, but Iranian oil was no longer allowed to leave. Reflecting this major disruption, WTI crude oil prices rose from an average of about $65 in February to $91 in March, with a daily peak of $114 in early April. Oil prices are now fluctuating between $85 and $120 depending on market participants’ projections on the future of the conflict and the ability of oil producers and transporters to spool up production and exportation.
It is worth noting that the U.S. was the world’s largest oil producer in 2025, producing 13.6 mb/d. With U.S. oil demand at 20.6 mb/d, U.S. extraction along with imports from Canada and Mexico means that the U.S. is not directly dependent on Gulf oil production. However, because crude oil is a globally traded commodity, its price is determined by world supply and demand. As a result, Americans are facing higher gasoline prices and related increases in costs such as airline fares. At the same time, U.S. oil producers are benefiting from higher prices, stronger profits, and rising export demand.
How will this oil price shock affect the U.S. economy? Figure 1 shows the monthly average spot WTI oil price since the 1970s. The latest spike, in March 2026, was about 45%. By comparison, oil prices rose about 210% during the first oil crisis in 1973–74, 140% during the second oil crisis in 1979, and 90% during the first Gulf War in 1990–91. All three of those shocks were associated with, and partly contributed to, recessions. However, we believe the current Middle East conflict is less likely to trigger a recession for several reasons.
First, the increase in oil prices is smaller this time. Second, markets are expecting the shock to be temporary, with prices likely to normalize once the conflict ends. In this sense, the current episode is more similar to the 1990–91 oil shock than to the shocks of the 1970s. Third, during the previous oil shocks the U.S. was much more dependent upon Gulf oil and therefore, the cutoff of Gulf oil had a greater impact.
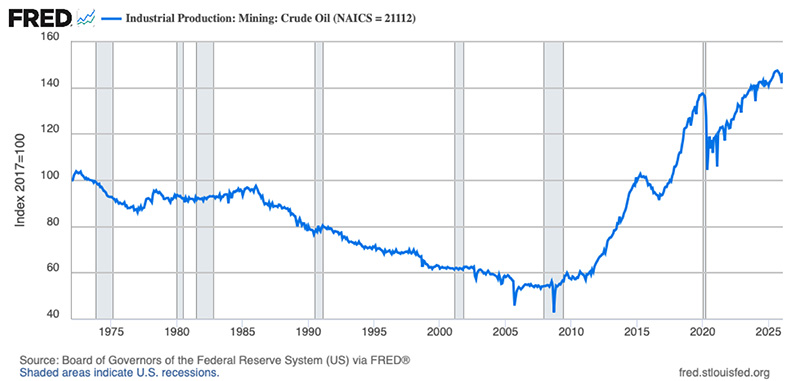
Fourth, because of technological progress, improved fuel efficiency, and the adoption of electric vehicles, Americans are less dependent on gasoline than they were in the 1970s. Finally, the shale revolution since the 2010s has made the U.S. the world’s largest oil producer. This means U.S. oil producers now have greater influence on global oil prices, rather than simply acting as price takers. Figure 2 shows U.S. industrial production of crude oil. Until 2010, U.S. oil production had been on a long downward trend. Since then, however, shale technology has driven a sharp turnaround and a strong upward trend.
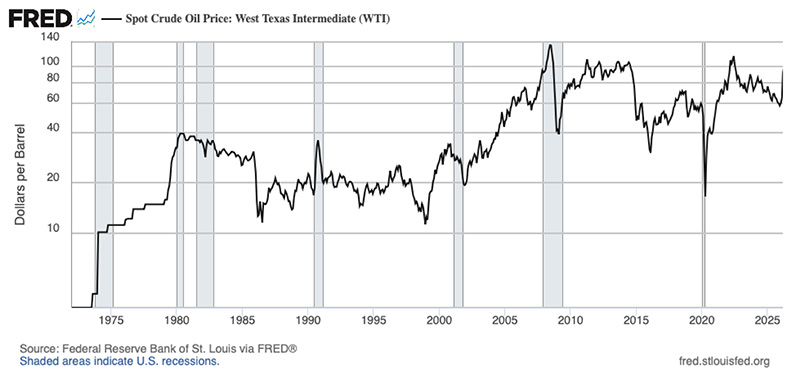
When Figures 1 and 2 are viewed together, an interesting pattern emerges. In 2014, 2015, and 2020, when oil prices fell below $60 per barrel, U.S. oil production also declined. This suggests that the marginal cost of developing and producing new oil in the U.S. may average around $60 per barrel. When prices are too low, producers have little incentive to expand output. By contrast, when oil prices rise, U.S. production tends to increase in response to stronger profit incentives. In this way, U.S. shale oil producers help stabilize the oil market by responding to price changes, which in turn helps push oil prices back toward a long-run equilibrium range of roughly $60 to $70 per barrel. Current crude oil futures prices on CME/NYMEX1 suggest such a convergence, declining from $92 in May 2026 to $76 in December 2026, to $70 in December 2027. Our forecast is more conservative, embodying a longer ramp-up time for U.S. producers and a longer recovery time for Gulf oil producers. Nevertheless, the pattern of oil price reductions is similar.
If WTI prices remain around $90, we would expect higher U.S. production and exports. In addition to boosting oil company profits, this would also support U.S. GDP through increased energy production. In summary, higher oil prices will certainly raise inflation and the cost of living, thereby squeezing household consumption. However, the effect on U.S. GDP growth is less clear because U.S. oil producers also benefit from higher prices. These countervailing impacts of higher oil prices lead to slower GDP and employment growth in our forecast for the near term but are not enough to generate a recession.
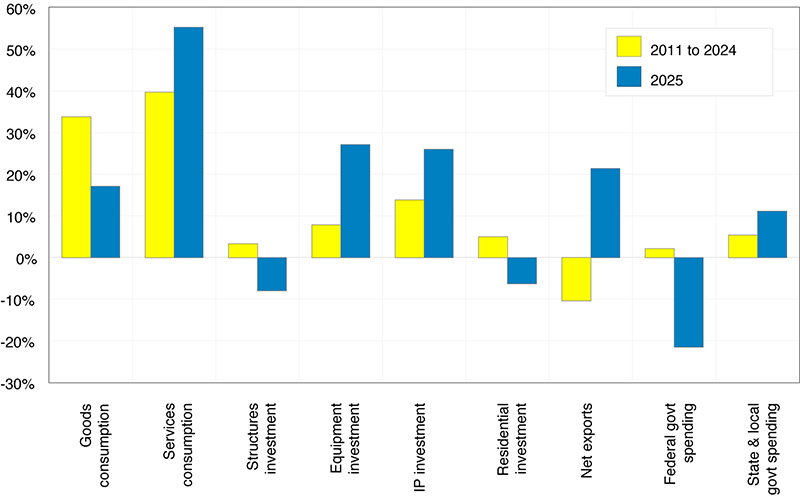
Over the past year, despite unprecedented uncertainty stemming from tariffs, federal spending cuts, and the federal government shutdown in October, the U.S. economy proved resilient. Real GDP growth in 2025 (Q4 over Q4) was 2.0%, compared with an average of 2.4% over the 2011–2024 period. A breakdown of GDP growth by expenditure in Figure 3 shows several unusual shifts in 2025. The contribution of goods consumption to GDP growth fell from 34% to 17%, reflecting tariff-related uncertainty surrounding imported goods. Services consumption remained the largest contributor, accounting for 55% of the 2.0% GDP growth in 2025. Structures and residential investment made negative contributions because of uncertainty and high interest rates. By contrast, equipment and intellectual property investment contributed much more in 2025 than in the 2011–2024 period, driven by the AI investment boom. Net exports also made an unusually positive contribution, largely because imports declined in response to tariffs.
Federal government spending was a significant drag on GDP growth, reflecting the administration’s efforts to downsize the federal government as well as the prolonged government shutdown. Note that from January 2025 to March 2026, federal government employment has declined from 3 million to 2.66 million, the lowest level since 1966.
Looking ahead, we expect AI investment to continue supporting economic growth in 2026. Based on publicly announced U.S. capital expenditure plans by Big Tech firms and major AI companies, total investment could reach around $650 billion in 2026, including Amazon’s $200 billion, Google’s $180 billion, Meta’s $120 billion, Anthropic’s $50 billion, and OpenAI/Stargate’s $100 billion. Of this data center investment, perhaps $250 billion could go toward imported AI chips from Taiwan and South Korea. On net, roughly $400 billion in domestic AI investment alone could add about 1.3% to U.S. GDP in 2026.
Operation Epic Fury could lift U.S. federal defense spending in 2026 to an additional $50 billion for munitions replenishment and related procurement. However, the additional defense expenditure would need to be authorized by Congress and as of this writing, that approval is uncertain. Federal government spending would then be less a drag on the economy in 2026 than in 2025. Tax cuts effective in the current year are expected to give the U.S. real GDP an additional 0.5% growth, assuming higher gasoline and food prices does not offset this growth. The reductions in Federal spending associated with the 2025 tax bill take effect in 2027 and therefore Federal spending for the year will return as a drag on GDP growth.
Following the Supreme Court’s decision on February 20 that IEEPA did not authorize the earlier tariff program, the Trump administration moved quickly to preserve broad-based trade leverage by invoking Section 122 of the Trade Act of 1974. That authority allowed the administration to impose a temporary across-the-board tariff, initially at 10% for up to 150 days, with the stated goal of addressing U.S. external imbalances while stopping collection of the invalidated IEEPA duties.
U.S. officials emphasized that trade negotiations with major partners would continue, and the administration is working to preserve or revise arrangements with economies with which it has already reached agreements. In parallel, the United States Trade Representative launched new Section 301 investigations targeting unfair trade practices among major trading partners with the aim of putting more durable tariffs in place before the Section 122 authority expires in July 2026. Section 301 tariffs require specific documentation of unequal trade practices, and the remedies are to be related to the specific damage. The process can be laborious, proceeding country by country or product by product, and the outcomes of the processes are considerably more predictable than the vicissitudes of tariff diplomacy under IEEPA. Therefore, the economic impact of tariffs imposed under the 1974 Trade Act should be less than those experienced thus far.
What was the impact of Trump’s tariff shocks on international trade? U.S. goods imports rose slightly from $3,266 billion in 2024 to $3,426 billion in 2025, while goods exports increased from $2,062 billion to $2,185 billion over the same period. As a result, the goods trade deficit edged up from $1,205 billion in 2024 to $1,231 billion in 2025. This suggests that tariffs did not reduce imports or narrow the trade deficit as much as the administration had anticipated. That said, the goods trade deficit as a share of GDP declined slightly from 4.1% in 2024 to 4.0% in 2025, indicating a minor improvement. Meanwhile, total goods trade—exports plus imports—as a share of GDP remained essentially unchanged at 18.2% in both years. In other words, Trump’s tariffs did not significantly weaken international trade or U.S. openness.
A similar pattern appears when services are included. Total trade as a share of GDP slipped only slightly, from 25.0% in 2024 to 24.6% in 2025, while the overall trade deficit narrowed from 3.1% of GDP to 3.0%, as shown in Figure 4, where the red line represents imports as a share of GDP and the blue line represents exports as a share of GDP. Overall, international trade relative to the size of the U.S. economy has returned to roughly its early-2000s level, and we expect it to remain around that level in 2026. This is in part due to the fact that many goods imported into the U.S. are not manufactured in the U.S. and in part due to the large Federal deficit and expanding investment, both of which have significant foreign financing.
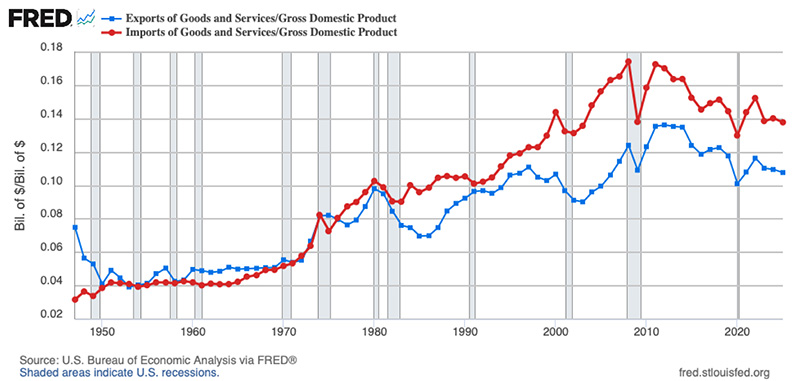
Figure 5 reports U.S. import values for four goods with national security significance that are subject to, or expected to be subject to, Section 232 tariffs, using 2019 as a pre-COVID benchmark alongside 2024 and 2025. Imports of computers and related accessories rose sharply from $131 billion in 2019 to $217 billion in 2024 and $362 billion in 2025, not because Americans are buying more laptops per se but because these imports also include AI-related equipment for data centers containing advanced semiconductor chips. Imports of cars and auto parts fell from $359 billion in 2024 to $318 billion in 2025 after the 25% Section 232 tariffs imposed in early 2025. Imports of steel and aluminum products also declined, from $67 billion in 2024 to $57 billion in 2025, following the Section 232 tariffs. Meanwhile, imports of pharmaceutical preparations increased in 2025. The administration has announced plans to impose future Section 232 tariffs on pharmaceutical products and semiconductors, including computers in this category, once domestic supply chains have built up sufficient production capacity. Over time, this suggests that U.S. imports of strategically important goods will become less dependent on foreign supply chains but the adjustment, requiring the investment in new factories, will take several years.
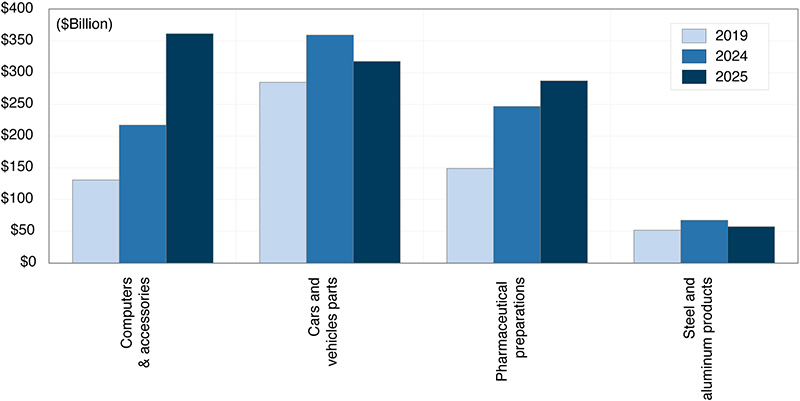
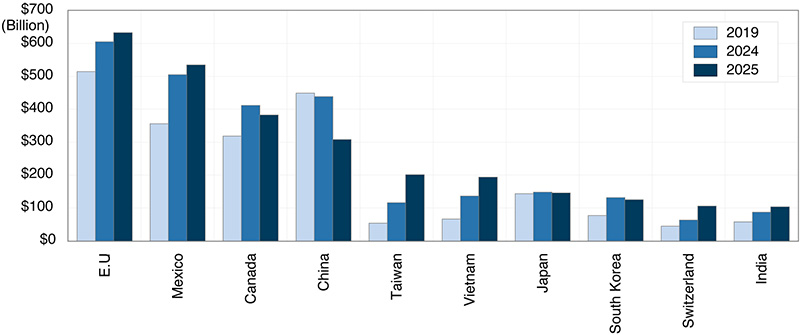
Figure 6 shows U.S. goods imports from the top 10 trading partners in 2019, 2024, and 2025. One notable change is China. Once the largest source of U.S. imports after the EU, China fell to fourth place, behind the European Union, Mexico, and Canada, as it has faced higher tariffs than other countries since 2018, along with a renewed escalation in trade disputes in 2025. At the same time, U.S. imports from Mexico and Vietnam increased significantly. Part of this shift reflects Chinese manufacturers relocating production to these countries to take advantage of lower labor costs and lower tariff exposure in the U.S. market. Imports from Taiwan also rose sharply, largely because of surging demand for advanced AI chips and related equipment amid the boom in AI and data center investment as noted in Figure 5.
A prime example of the changes taking place is the growing diversification of Apple’s supply chain, which once played a major role in building China’s modern technology ecosystem. U.S. cell phone imports from China fell sharply from $64 billion in 2024 to $39 billion in 2025. The share of U.S. smartphone imports coming from China declined from a peak of 66% in 2018 to 57% in 2024 and then to 36% in 2025. At the same time, India’s share rose from nearly 0% in 2018 to 7% in 2024 and 21% in 2025. Cell phones have now become the largest product category the U.S. imports from India.
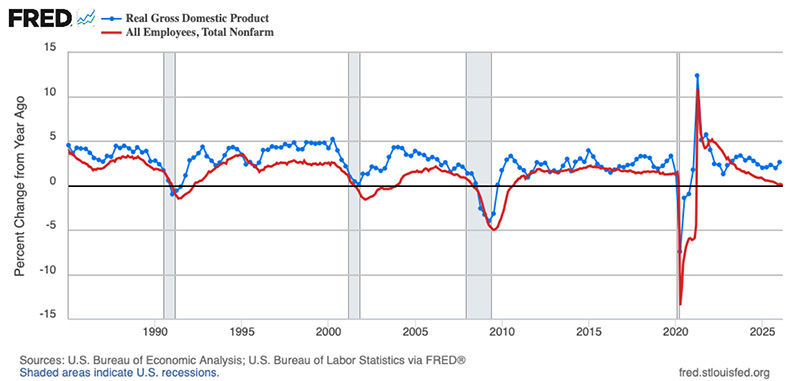
Figure 7 compares the year-over-year growth rates of real GDP and nonfarm payroll employment. The gap between these two growth rates reflects labor productivity growth. Over the past two years, this gap has widened noticeably, becoming much larger than it was during the 2010s.
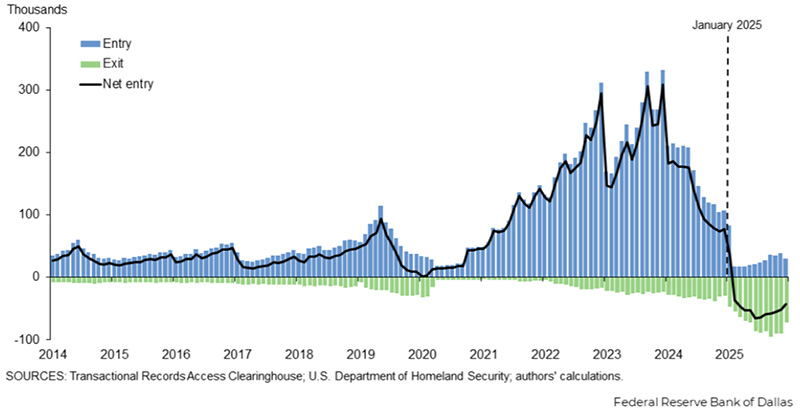
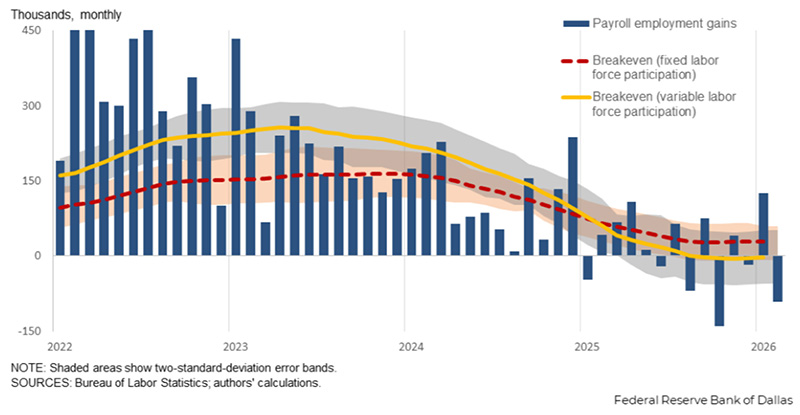
One possible factor is immigration policy. Using immigration court data, the Federal Reserve Bank of Dallas published estimates of net outflows of unauthorized immigrants since 2014, as shown in Figure 8. Since February 2025, the administration’s immigration policy appears to have significantly reduced entries and increased exits, leading to a decline in the unauthorized immigrant population for the first time in this series. Based on this information, the Dallas Fed estimated that breakeven employment growth has fallen to roughly zero in recent months (Figure 9). That, coupled with retirements of baby boomers, explains the bulk of the current labor market situation.
In summary, although it is difficult to predict the next geopolitical shock, three major sources of uncertainty from 2025—tariff policy, federal government downsizing, and immigration policy—have largely run their course and are likely to stabilize in 2026.
Concerns that AI investment is simply a bubble have also eased somewhat. Major technology firms are now showing clearer paths to monetization: Microsoft said in early 2025 that its AI business had already surpassed a $13 billion annual revenue run rate, while Alphabet reported that Google Cloud revenue continued to grow strongly in 2025, supported by AI products. Meta’s 2025 results also showed robust revenue growth, suggesting that AI is already improving the efficiency of its advertising business. Leading standalone AI firms show the same pattern. OpenAI’s annualized revenue rose above $25 billion by February 2026, while Anthropic’s reached about $9 billion by early 2026, driven by strong demand for enterprise and coding AI tools. As a result, AI and data center investment should remain a resilient source of support for U.S. economic growth in 2026.
It is estimated that China’s crude oil demand averaged about 15.4 mb/d in 2025 and its crude oil imports totaled 11.6 mb/d. Figure 10 shows that China’s crude oil imports have been trending upward though at a slower pace, underscoring the country’s heavy reliance on foreign oil. In the first quarter of 2025, China imported about 5.4 mb/d of crude through the Strait of Hormuz. In other words, oil that flows through the strait accounted for roughly 35% of China’s crude oil consumption and about 47% of its crude oil imports. Included in that total for 2025 was an average of about 1.4 mb/d of Iranian oil. China is therefore much more exposed than the U.S. to Middle Eastern oil flows. That said, China’s large oil stockpiles and increasingly diversified supplier base provide some buffer against a short-term disruption. This only represents Chinese consumption of petroleum. The Chinese economy is still an export-driven economy and higher world oil prices feed into the cost of transporting goods to foreign markets. While these costs are offset by the increased demand for China’s EV production, the inflationary hit to households diminishes the demand for other goods produced in China’s factories. Thus China is not entirely insulated from events in the Middle East, and a prolonged disruption would raise China’s internal energy costs and create broader macroeconomic risks.
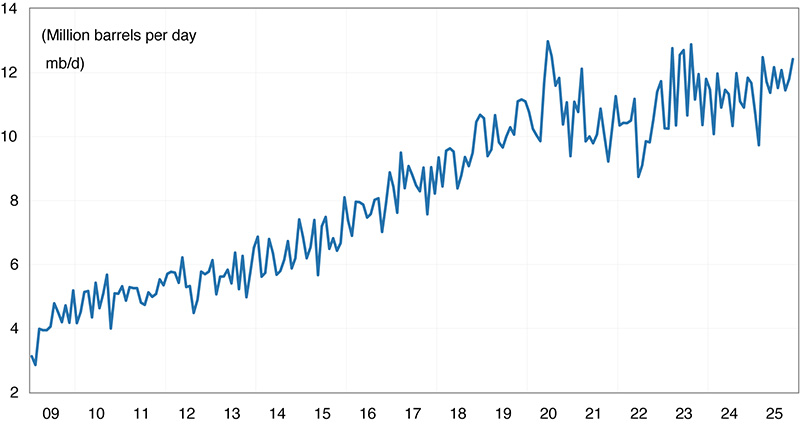
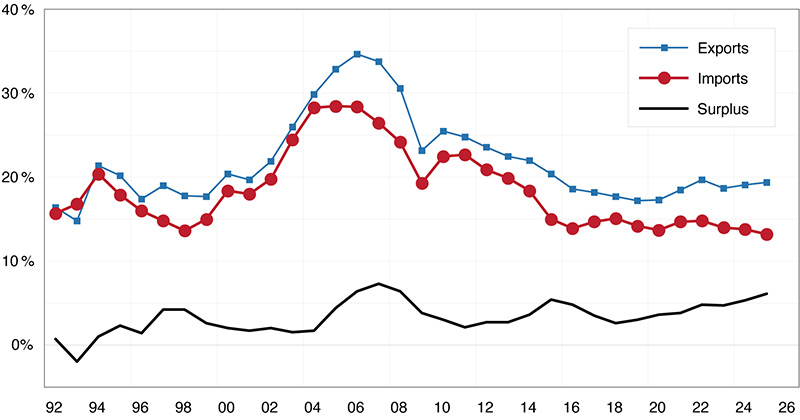
Figure 11 shows China’s goods exports, imports, and trade surplus as a share of GDP since 1992. Although China’s total trade share of GDP has declined from its 2006 peak as the economy has grown, its trade imbalance has widened steadily over the past decade. Goods trade surplus rose to 6.1% of GDP, approaching the historical highs reached in 2006–2008. In 2025, China recorded a goods trade surplus of about $1.2 trillion with the rest of the world. In previous reports, we discussed these persistent external imbalances, and the latest data suggests little, if any, change. China’s policy framework continues to support industrial investment, boosting production capacity, price competitiveness, and exports, while at the same time suppressing household income growth and consumption, thereby weakening import demand. These imbalances create negative spillovers for trading partners and are likely to intensify trade tensions. There is increasing unease among China’s trading partners with respect to China’s aggressive export strategy. What is seen as a positive for employment in China is seen as somewhat of a negative in the U.S. and elsewhere. The imbalances in the Chinese economy that we have written about before persist.
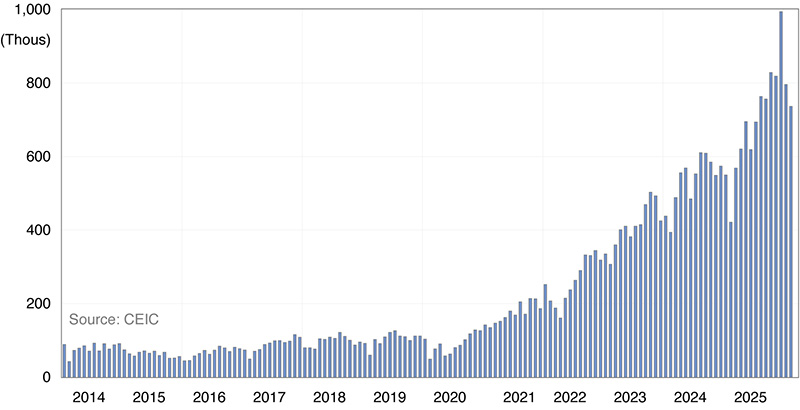
The meteoric rise of China’s auto industry in recent years provides a striking example. China is now the world’s largest auto producer, manufacturing about 34 million passenger and commercial vehicles in 2025. Since 2023, China has also become the world’s largest auto exporter, surpassing Japan. Figure 12 shows China’s monthly car exports to the rest of the world, which have risen sharply since 2020. Price competitiveness helps explain this rapid expansion. In the UAE market, for example, an entry-level Volkswagen Jetta sells for about $24,800 USD, a Toyota Corolla for $20,900 USD, and a Hyundai Elantra for $20,400 USD, while China’s MG 5 is priced at only about $13,000 USD. Given this aggressive pricing, it is not surprising that Chinese cars and auto exports have gained market share so quickly in global markets.
As of early 2026, major economies had responded to China’s rapid expansion in automobile exports with a mix of tariffs, trade defense measures, and other market access restrictions. The U.S. has taken the hardest line, imposing a 100% tariff on Chinese EVs and adding connected-vehicle security rules that effectively shut Chinese passenger cars out of the market. The European Union has adopted a more rules-based approach, imposing anti-subsidy duties on China-made battery electric vehicles while still allowing limited market access under tighter conditions. Canada and Mexico have also moved in a more protective direction, with Canada shifting from a 100% surtax to a quota-based system and Mexico sharply raising tariffs on autos from non-FTA countries, including China. Taken together, these responses suggest that major economies increasingly view Chinese car exports not as ordinary trade but as a challenge tied to industrial policy, subsidy competition, and in some cases, national security.
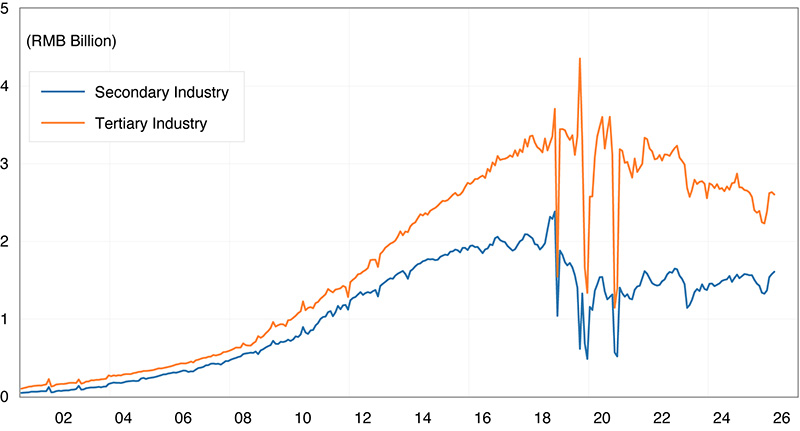
In addition to, and closely related to China’s external imbalance problem, the country also faces a chronic internal imbalance: overinvestment, as discussed in previous reports. Figure 13 shows China’s monthly nominal fixed-asset investment in the secondary industry (mainly manufacturing) and the tertiary industry (including real estate and transportation infrastructure). Investment in the tertiary industry has been on a clear downward trend since 2022, following the collapse of the real estate bubble. By contrast, investment in the secondary industry has remained relatively elevated, fluctuating around RMB 1.5 billion per month since the end of the pandemic. Total investment once accounted for as much as 55% of GDP in China in 2019. It declined to 38% in 2024 and to 35% in 2025. This represents meaningful progress away from the old investment-driven growth model. Even so, China still has a long way to go. By comparison, for 2025 in the U.S., despite aggressive spending by large technology firms on AI and data centers, total fixed investment accounted for 18% of GDP, roughly half that of China’s.
This helps explain the logic of China’s 15th Five-Year Plan (2026–2030). Based on the recommendations adopted by the Communist Party in October 2025, the plan continues the broad direction of the previous cycle while placing even greater emphasis on high-quality growth, a modernized industrial system, stronger domestic demand, technological self-reliance, and national security. In other words, Beijing appears to recognize that the old model of relying heavily on property, infrastructure, and investment-led expansion is no longer sustainable. The plan therefore aims to rebalance growth toward stronger household consumption while still reinforcing the real economy through industrial upgrading, strategic emerging sectors, greener development, and improved infrastructure. In practical terms, the 15th Plan is Beijing’s blueprint for making China more resilient, technologically advanced, and less vulnerable to external pressure. At the same time, it also suggests that China’s adjustment away from overinvestment will be gradual, because the government still relies heavily on industrial policy and state-guided investment to achieve these goals. The same general goals were articulated in the 14th Five-Year Plan and there have been no meaningful policy changes to achieve them. Although that might change as the 15th Five-Year Plan evolves into policy tactics, the historical pattern of Beijing’s very gradual approach to reform suggests that over the coming several years, not much structural change will occur.
China’s economy remains structurally imbalanced. Growth in 2025 was supported by policy stimulus and exports, but the property slump and weak domestic demand continue to weigh on the economy. Still, China has notable strengths: its power infrastructure is well positioned to support AI expansion, its AI sector remains close behind the U.S., and its auto and robotics industries are expanding aggressively. Looking ahead, growth is expected to slow in a pattern typical of a balance sheet recession, amid deflationary pressure and downside risks from trade tensions as well as external geopolitical and energy shocks.
The Iran war has accelerated the move away from globalization. For the U.S., self-reliance has become even more important. The strength of the U.S. economy as evidenced by output data has delivered positive growth through heightened policy and geopolitical uncertainty and is expected to continue to do so. Nevertheless, higher energy prices will feed into higher inflation, inevitably constraining expansionary monetary policy. For China, the Iran war coupled with resistance on the part of its trading partners to aggressive export-led growth puts pressure on Beijing to institute meaningful reforms. For both countries, the economic engagement issues are unchanged and the gradual decoupling continues. The ultimate conclusion of the war and the upcoming summit between Beijing and Washington ought to clarify the highly uncertain current landscape with respect to China/U.S. trade through the next couple of years.
Cathay Bank has commissioned UCLA Anderson Forecast to produce a U.S.-China Economic Report series that focuses on current topics affecting investment flows and associated economic events between China and the United States.
UCLA Anderson Forecast has been the leading independent economic forecast of both the U.S. and California economies for 70 years.
This report includes forecasts, projections, and other predictive statements that represent UCLA Anderson Forecast’s economic analysis and perspective on the current state and future outlook of the United States and China economies based on the available information. These forecasts take into account industry trends and other factors and involve risks, variables, and uncertainties. This information is given in summary form and does not purport to be complete. Information contained in this report should not be considered advice or recommendation for a particular course of action and does not take into account any particular business objectives, financial situation, or needs.
Readers are cautioned not to place undue reliance on the forward-looking statements. UCLA Anderson Forecast does not undertake any obligation to publicly release the result of any revisions to these forward-looking statements after the date of this report. While due care has been used in the preparation of the forecast information, actual results may vary in a materially positive or negative way. Forecasts and hypothetical examples are subject to uncertainty and contingencies beyond the control of UCLA Anderson Forecast.
Jerry Nickelsburg joined UCLA’s Anderson School of Management and The Anderson Forecast in 2006. Since 2017 he has been the Director of The Anderson Forecast. He teaches economics in the MBA program with a focus on Business Forecasting and Asian economies. He has a Ph.D. in economics from the University of Minnesota and studied at The Virginia Military Institute and George Washington University. He is widely published and cited on economics and public policy.
William Yu joined the UCLA Anderson Forecast in 2011 as an economist. He focuses on economic modeling, forecasting, and the Los Angeles economy. He also researches and forecasts on China’s economy and its relationship with the U.S. economy. His research interests include various economic and financial issues, such as time series econometrics, data analytics, stock, bond, real estate, commodity price dynamics, human capital, and innovation.

