
Welcome to the first of a series of periodic reports emanating from a newly established collaboration between The UCLA Anderson Forecast and Cathay Bank. In this series we will present economic analysis and perspective on the current state and future outlook of the two largest economies in the world: The United States and China. While there are many political, historical and sociological factors that affect U.S.-China relations, in this series of reports our objective is to focus on elucidating the underlying economic environment as it relates to the interrelationship between the U.S. and China.
The birth of this report series comes at an exciting yet turbulent time. It is the era of “America First” as promoted by President Trump, and “The China Dream” as promoted by President Xi. “America First” and “The China Dream” are in some ways complementary and in others competitive. They recently clashed on March 22 when President Trump announced that the U.S. will use USTR Section 301 to impose tariffs to counter some of China’s current trade practices and on April 1 when China responded with tariffs of up to 25% on 128 items imported from the U.S. This was followed by the Trump Administration imposing tariffs on $50B of Chinese exports to the U.S. specifically targeting “The China Dream” priorities of future technological development and China responding with proposed tariffs of a similar magnitude specifically targeting priorities of the “America First” agenda.
In this report, we will explain some economic underpinnings of these trade tensions, the possibility that there will be a trade war, and were that to happen, the potential impact on these two economies. We first outline the basic facts that both sides are working with. Following that, we present the economics of the most important potential points of conflict; trade imbalances and technology transfer and their implications for the economic motivation of each. We conclude with some observations on the current likelihood of a sustained trade war erupting.
There are two major sources of trade tensions between the U.S. and China: (1) A relatively large trade imbalance between these two countries and the perception in Washington that this is harmful to the U.S., and (2) Chinese policies requiring joint ventures in some sectors and foreign technology transfers in some industries in exchange for entrance to the large and potentially lucrative Chinese market.
The focus of the political rhetoric on the balance of trade has been on the trade balance in physical goods rather than the trade balance in goods and services. Goods and services production, consumption and trade is the usual and correct way to measure economic activity. Nevertheless, we will document goods trade initially to link to the public discourse on this subject.
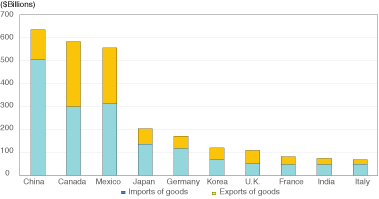
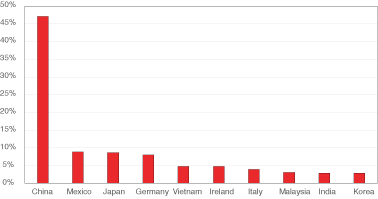
Figure 1 displays the ten largest U.S. trading partners in merchandise goods imports (in blue) and exports (in yellow) in 2017. The U.S.’s largest trading partner is China with total trade amounting to $636 billion. Imports comprised $506 billion of that number and exports $130 billion. The next largest trading partner is Canada, at $582 billion with imports of goods at $300 billion and exports at $282 billion. Then comes the other NAFTA member Mexico, at $557 billion in goods trade with imports at $314 billion and exports at $243 billion. It is obvious that the trade imbalance in goods between the U.S. and China is relatively large compared to other countries. Figure 2 provides another way to look at goods trade imbalances. It shows the percentage of goods trade deficit by country divided by the total U.S. goods trade deficits ($796 billion) in 2017. The U.S. trade deficit with China, $375 billion, accounts for 47% of the total U.S. trade deficit, followed by Mexico and Japan at 9%, and Germany at 8%.
The above analysis, focusing on merchandise goods trade, misses an essential part of trade: services. The United States is primarily a service producer. Over 2/3 of U.S. GDP is generated by the production of services and this constitutes an important part of U.S. exports. Some examples are: Hollywood movie distribution and collecting international royalties on box office receipts, Chinese international visitors and students at U.S. schools; an export of tourism and educational services; and Microsoft and Qualcomm selling software and licensing intellectual property abroad; an export of these services. These are just a few of many examples in which the U.S. exports services from which it receives revenue from foreign countries.
Figure 3 presents combined goods and services imports (in blue) and exports (in yellow) for the top ten trading partners of the U.S. With respect to the trade balance, China’s deficit of $337 billion is the largest, followed by Mexico at $69 billion, Germany at $68 billion, and Japan at $56 billion. Note that by measuring trade to include goods and services, U.S. has a trade surplus of $3 billion with Canada.
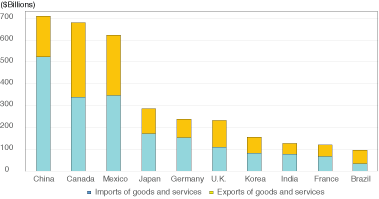
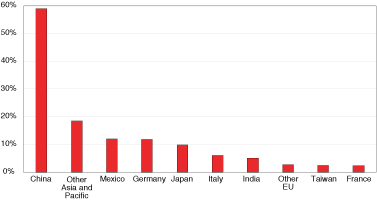
Figure 4 shows the top ten countries/regions with the largest percentage of goods and services trade deficit as a percentage of the total U.S. goods and services trade deficits ($572 billion) in 2017. By this measurement, China accounts for 59% of the total U.S. trade deficit.
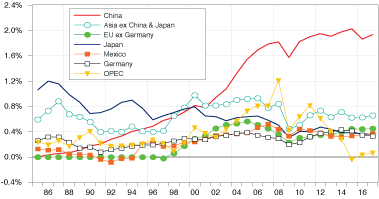
To provide a historical perspective on the merchandise goods portion of trade, Figure 5 shows U.S. trade deficits with selected countries/members over U.S. GDP from 1985 to 2017. We can easily see that merchandise trade deficits with China (red line) have steadily increased from 2001, the year China joined the World Trade Organization (WTO).
Some might recall from history that there were similar trade tensions between the U.S. and Japan in the 1980s. As a point of comparison (Figure 5) Japan’s trade surplus with the U.S. peaked in 1986 at 1.2% of U.S. GDP, below the current 1.9% with China.
It has been argued that this kind of bilateral calculation of trade deficits, a calculation favored by the current administration in Washington, might not be representative of the true economic relations as China imports a significant quantity of components and intermediate goods, assembles them, and then re-exports them to the U.S. The most widely used example is Apple’s iPhone.1 It was estimated that of the $220 cost of an iPhone 7, the assembly cost was only $5. If we assume all the assembly work is done in China, and that all iPhone’s components are imported to China from other countries, then it would be inappropriate to claim a larger deficit for China using the assembled iPhones with a transfer price of $220 as solely a China export to the U.S. However, the magnitudes in this example may be overstated2 as there are 349 Apple suppliers in China. Koopman, Wang, and Wei (2012)3 estimate that the share of domestic content in China’s manufactured exports was about 50% prior to China’s WTO membership, and has risen to nearly 60% since then. Nevertheless, it is important to consider this analysis in the context of the complex global supply chain of the modern world. Where the cost of any particular tariff falls will depend on where in the supply chain the tariff is imposed and where in the world economy the supply chain runs.
If we aggregate all the merchandise imports and exports of a country with the rest of the world, China, as the world factory, is the country with the largest merchandise trade surplus with the rest of the world, valued at $494 billion, followed by Germany’s $301 billion in 2017. On the other side, the U.S. is the country with the largest merchandise trade deficit, valued at $753 billion.
Economics 101 teaches us that free trade is beneficial to countries that engage in it because the economic pie will be bigger for all. Thus, the gains of the winners will be more than enough to compensate the losses of the losers. The reality is that it is difficult to identify winners and losers as they are diffuse, and it is even more difficult to induce a transfer from one to the other so that both are better off. For example, factory workers who lost their jobs ought to have been compensated by, among others, Wal-Mart shoppers who were able to purchase goods at a much-reduced price, but how this compensation might be accomplished remains a conundrum. Even though there were some attempts through training programs and adjustment subsidies, in the recent process of globalization, the winners did not compensate the losers and consequently we are seeing a rising income inequality.
Leamer (1996) and Wood (1995) provide some evidence of this.4 The problems of dislocation and inequality resulting from international trade could be exacerbated by large trade imbalances. Autor, Dorn, and Hanson (2013)5 find rising Chinese imports caused higher unemployment, lower labor force participation, and reduced wages in areas that were home to industries competing with the imports.
Autor, Dorn, Hanson, and Majlesi (2017)6 find that districts facing more competition from Chinese manufacturing also tend to elect politicians who advocate protectionist trade policy. The U.S. is far from alone in this reaction to globalization. The literature suggests that British regions more exposed to trade with China voted more strongly to support Brexit7 and French and German regions more exposed to trade with low-wage countries tended to vote for protectionist-oriented politicians8 as well. This political reality makes it more likely that the Trump Administration will continue a protectionist policy vis-a-vis China.
An important question to ask is why a trade imbalance might exist. A simple and straightforward answer is: When a country spends more than it produces/earns, it will run a trade (current account) deficit and when a country spends less than it produces/earns, it will run a trade surplus. In a nutshell, the source of the U.S.’s chronic trade deficit is that Americans spend too much and save too little while China, Japan, and Germany do the opposite. The principal dissaver in the U.S. is the Federal Government. China and Japan, with their excess dollars, lend money to the U.S. to finance the Federal fiscal deficit; money that U.S. taxpayers and savers are unable to provide. As a consequence, foreign loans to the U.S. Government grew by 7.0% last year.
Is that an economic problem? Baily and Bosworth (2014)9 argue that the U.S. cannot afford an ongoing trade deficit of 3% or more of its GDP for various reasons including protecting its manufacturing base. There are many others who argue that so long as the trade deficit remains moderate with respect to GDP, it represents a gain for the deficit running country. The economic record is mixed and is critically related to how the deficit financed borrowing is used. If it is invested in infrastructure, for example, the benefit is different from a trade deficit that is used for current consumption.
If we know the root cause and it is deemed desirable to reduce the current account trade deficit, as put forward in the “America First” platform, then the solution is obvious: the U.S., both in the private and government sectors, should spend less and save more. But, the now increasing U.S. government deficits will move U.S. trade deficits in the opposite direction.
And if China were to desire a reduction in its trade surplus, then the solution would be to consume more and save less. However, “The China Dream” which embodies the “Belt and Road Initiative” envisions massive overseas investment by China which must be financed with continued trade surpluses.
Absent changes in savings behavior, the overall trade imbalance will not abate, though particular policies could shift the U.S. deficit from one county to another and from one type of good or/and service to another. Current trade tensions with China, spurred on by the perception that bilateral trade policy would reduce the overall trade deficit, could well do the latter and in doing so shift the U.S. deficit to South-East Asia from China.
The second reason for the Trump administration’s trade policy with respect to China is based on the Chinese government strategies to acquire U.S. intellectual property. From the Chinese perspective they are a developing country which requires modern technology to catch-up to advanced countries. This is codified in their “Made in China 2025” initiative. To affect this China has been acquiring Western technology and know-how while providing roadblocks to U.S. and European firms working in China. As a result, Chinese companies learn how to use this transferred technology to grow without competition in their home market. These non-tariff barriers to trade are perceived in Washington as providing an unequal playing field in the arena of international trade.
In addition, the U.S. is increasingly worried that China is acquiring cutting edge technology through the purchase of American companies while not allowing other U.S. companies to compete in China with similar technology. The recent case where the Committee on Foreign Investment in the U.S. (CFIUS) rejected Broadcom’s offer to buy Qualcomm is a demonstration. CFIUS expressed concern that the acquisition might help the Chinese company Huawei dominate 5G technology in wireless communication.
There are certainly national security concerns which power the policy towards Chinese FDI in the United States and Chinese rules of engagement for U.S. companies doing business in China. The purely economic rationale is not as clear. Nevertheless, as a matter of policy, The U.S. is opposed to restrictive non-tariff barriers on the one-hand, and the Chinese believe them to be necessary in order to become a developed modern country on the other. This has and will likely continue to result in trade tensions over this issue.
To pursue “America First,” as currently constituted, the U.S. will continue its negotiating posture of using tariffs and restrictions on FDI and technology transfer. To pursue “The China Dream,” as currently constituted, China will continue to advocate for free trade agreements internationally while engaging in tariff and non-tariff policies to protect and foster domestic industries. These two policies are in direct conflict with each other. The open question is whether or not the two countries will find sufficient common ground for compromise. In the latest UCLA Anderson Forecast we assume that they will. As of this writing, there is both aggressive posturing and olive branches in the offing. Indeed, the negotiations thus far on two other trade agreements, South Korea and NAFTA, and the exceptions made on the steel and aluminum tariffs suggest this will be the case. However, the incompatibility of the economic goals of the two countries means that there is a risk that a full-blown sustained trade war will ensue, and the economic history of trade wars tells us that this will have a significant negative impact on both countries. Future Cathay Bank/UCLA Anderson Forecast reports on U.S.-China economic relations will update the economic rationale and consequences of policy as it unfolds.
Cathay Bank has established a sponsorship relationship with UCLA Anderson Forecast to produce a U.S.-China Economic Report. In this report, UCLA Anderson Forecast will talk about their view of economic analysis and perspective on the current and future outlook relating to the two largest economies in the world – the United States and China.
UCLA Anderson Forecast has been the leading independent economic forecast of both the U.S. and California economies for over 65 years. The annual report and quarterly columns written by UCLA Anderson Forecast will focus on current topics affecting investment flows and associated economic events between China and the United States.
This report includes forecasts, projections and other predictive statements that represent UCLA Anderson Forecast’s economic analysis and perspective on the current state and future outlook of the economies of The United States and China in light of currently available information. These forecasts are based on industry trends and other factors, and they involve risks, variables and uncertainties. This information is given in summary form and does not purport to be complete. Information in this report should not be considered as advice or a recommendation to you or your business in relation to taking a particular course of action and does not take into account your particular business objectives, financial situation or needs.
Readers are cautioned not to place undue reliance on the forward-looking statements in this report. UCLA Anderson Forecast does not undertake any obligation to publicly release the result of any revisions to these forward-looking statements to reflect the occurrence of unanticipated events or circumstances after the date of this report. While due care has been used in the preparation of forecast information, actual results may vary in a materially positive or negative manner. Forecasts and hypothetical examples are subject to uncertainty and contingencies outside UCLA Anderson Forecast’s control.
Jerry Nickelsburg joined the UCLA’s Anderson School of Management and The Anderson Forecast in 2006. Since 2017 he has been the Director of The Anderson Forecast. He teaches economics in the MBA program with a focus on Business Forecasting and on Asian economies. He has a Ph.D. in economics from the University of Minnesota and studied at The Virginia Military Institute and George Washington University. He is widely published and cited on issues related to economics and public policy.
William Yu joined the UCLA Anderson Forecast in 2011 as an economist. At Forecast he focuses on the economic modeling, forecasting and Los Angeles economy. He also conducts research and forecast on China’s economy, and its relationship with the US economy. His research interests include a wide range of economic and financial issues, such as time series econometrics, data analytics, stock, bond, real estate, and commodity price dynamics, human capital, and innovation.

