
在最新一期的报告「充满不确定性的经济与全球供应链的重塑 美国—中国经济前景」中,我们讨论几个美中两国双方在激烈的升息、不稳定的金融市场以及广布的国内问题下皆面临的关键经济挑战。这份报告除了展望2023年与未来,同时也探索这多变的情况在影响全球供应链与长期政治关系之外,如何影响美国与中国的未来。
让我们一起阅读下去,加入经济学家俞伟雄与加州大学洛杉矶分校安德森预测中心总监Jerry Nickelsburg的行列,看看他们如何解析这个复杂的经济环境与关于未来这一年的宝贵分析。
2023年,依然是美中经济充满不确定性的一年。美联储在过去的十二个月把利率从0%调整到了4.6%。经此一连串激进的加息,我们看到通膨率的放缓以及负面的经济结果。2023年3月10日硅谷银行(Silicon Valley Bank,简称SVB)的突然倒闭更是对金融界产生巨大的震撼。在硅谷银行被挤兑420亿美元后,美国联邦监管机构随即接管这家美国第十六大、拥有1,950 亿美元资产的银行。为了避免恐慌散布至整个银行界,美国监管机构采取了紧急措施,为硅谷银行的所有存款进行担保,这意味着其他所有银行的存款也同时受到担保。除了硅谷银行之外,美国第29大的标志银行(Signature Bank)也被接管。现在要讨论的问题是:究竟美联储是否会持续激烈的升息以对抗通膨?还是会暂停升息的脚步甚至降息以稳定风波不断的银行界?此时此刻,美联储的货币政策正面临着艰巨的挑战,以兼顾其三项目标:价格的稳定性、金融的稳定性以及低失业率。
在太平洋彼岸,中国的经济也正面对重重困难。2022年中国施行数以月计的新冠肺炎清零政策,其严苛程度严重地干扰了社会经济活动,现在中国终于重新开放了。受到过去各种新冠肺炎政策的不良影响以及房地产市场的困扰,全国各处的地方政府皆出现严重的财政赤字。
华盛顿与北京政府在面对两国国内问题的同时,也对彼此更加地不信任。不信任的程度可以从美国国务卿布林肯(Blinken)原定二月访中的计划中看出。出访前夕,一个源自于中国的气球飞到美国上空,因而破坏了访中行程。究竟恶化的美中政治关系会如何影响两国的经济关系?在这份报告中,我们将会透过美国与中国的经济以及联系两者的全球供应链这三个角度提供一些关于这个问题的见解。
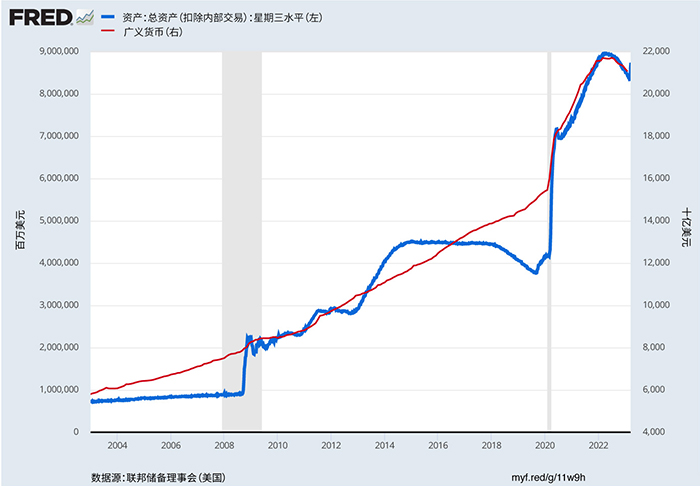
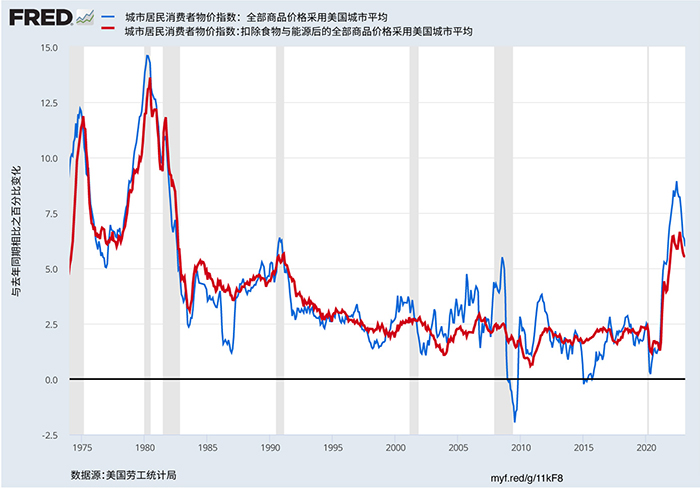
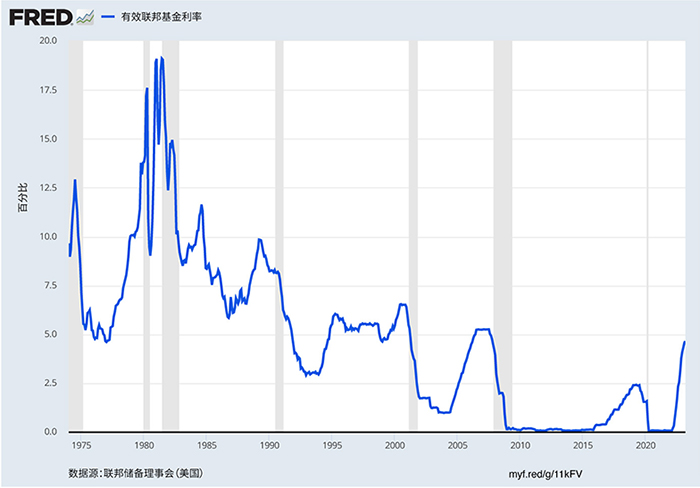
因为疫情而采取的扩张性货币政策以及财政刺激造成了银行系统中货币供给的大幅增加。图一显示美联储的货币总量(货币基数)。从2020年2月至2021年4月,其增加幅度达4.8万亿美元。广义货币(M2)则是在2020年2月至2022年4月间增加了6.5万亿美元。如此前所未见的货币流动性提升同时,产生了由需求引发的通货膨胀(图二)以及一个让美联储升息政策有潜在机会造成金融市场失衡的环境(图三)。
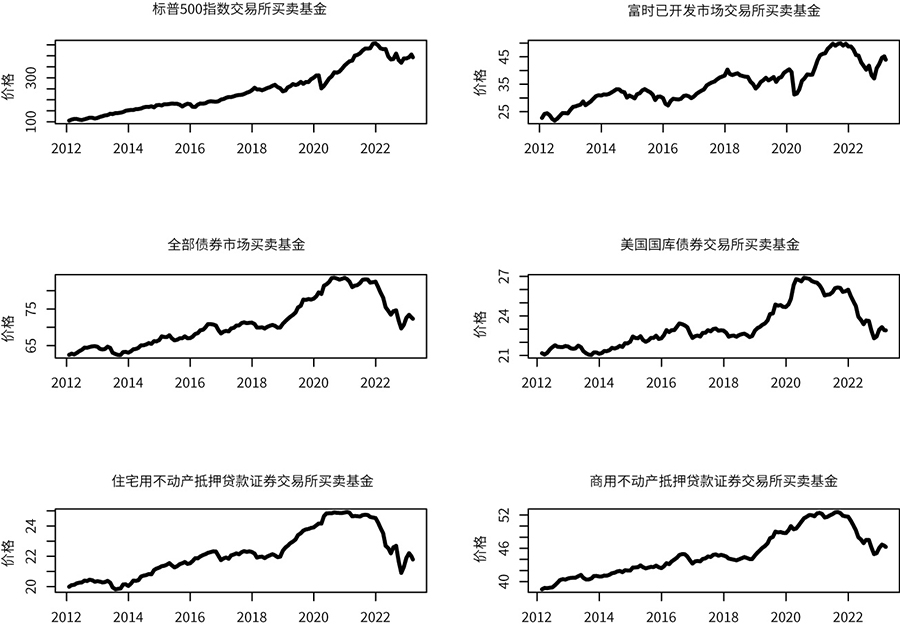
图四显示自2012年以来美国(标普500)及国际股票(富时欧亚已开发市场)、总体债券市场、美国国库债券、住宅与商用不动产抵押贷款证券(MBS)的交易所买卖基金(ETF)价格。我们可以看到在升息的环境下,有利率风险的债券及不动产抵押贷款证券交易所买卖基金承受了比股票交易所买卖基金更多的损失。举例来说,在2021年1月至2023年3月15日这段期间内,美国股票的价格上涨了8%,国际已开发市场的股票价格下跌了3%,但风险更高的债券与不动产抵押贷款证券则是损失了13%的价值。由于我们仍然不清楚华盛顿会采用何种政策来面对金融与实体经济中的压力,此金融市场的不确定直接反应在了实体经济中的不确定。
基于上述的不确定性,我们提出两个美国经济的预测情景:(1)经济衰退与(2)没有经济衰退1。两个情景不同的地方在于美联储采取的货币政策轨迹。如果美联储认定通膨是经济中最大的问题而持续提升联邦基金利率以对抗通膨,我们预测经济衰退会在2023年的第三季开始。在此情景下,房地产以及商用不动产市场会疲软,耐久财的消费会减少,商务投资亦会降低,失业率则是会上升。不过,在过去十年房市没有获得过多投资以及进入2023年时经济中没有其他显著失衡的这两项假设下,此预测中的经济衰退程度较轻微。
另一方面,如果美联储决定金融市场的稳定与就业率的最大化是更重要的目标,他们会停止升息,甚至是开始降息。他们也会停止量化紧缩。在这个情景下,人们对于金融市场稳定性的信心将会回归,金融损失会缓和,房市亦会开始复苏。虽然通膨会比较严重,但2023年不会出现经济衰退的情况。
根据中国国家统计局(NBS)统计,中国的国内生产总值在2022年增加了3%。考虑到新冠疫情的爆发以及国内各种疫情相关的严苛政策,这个成长率又再次高于很多预测者的预估。美国加州大学洛杉矶分校安德森预测中心(UCLA Anderson Forecast)开发了一个替代的模型以估算中国国内生产总值的成长2。这个模型采用四个主要变量的年成长率,而它们2022年的数据分别是:能源消费年成长率0%、二氧化碳排放年成长率-1.5%、总贸易年成长率(出口加进口)7.7%,以及房价涨幅年成长率-5.1%。透过预测中心的模型,我们认为中国2022年的国内生产总值成长率大概是1.1%。此数字低于中国官方的估算。图五比较了我们模型所估算的中国历年国内生产总值(红线)以及中国国家统计局的官方数字(蓝线)。基本上,我们估算的成长率低于官方的数字,也比官方的数字更具有变动性。不过,两个中国国内生产总值的估算都呈现平缓或下滑的趋势。
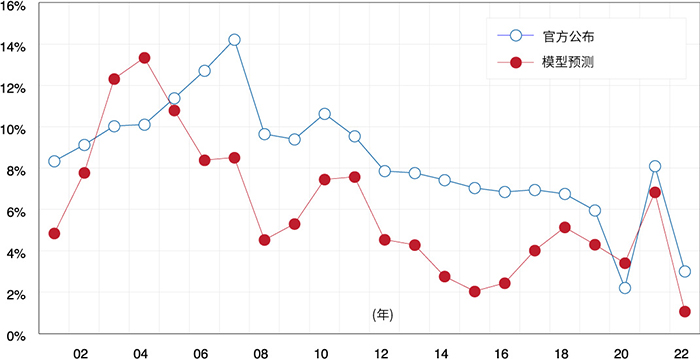
近年来,中国再度迈向计划经济,掌控商业与经济活动。举例来说,北京政府采取了激进的手段以管控科技与地产公司,也令富人增加对社会的回馈来实践「共同富裕」的目标,更坚持施行严苛的新冠疫情政策。最近几个月,中国领导人逆转了政策方向,并表示之后会对私人产业展现新的商业友好态度。然而,究竟有什么东西改变了?我们认为比起官方的数字,我们的国内生产总值预测更接近真实的情况。这个认定是基于我们对以下情形的观察:身陷危机的地产市场、开发者与借贷机构面对增高的金融风险、渐缓的经济、拥有大学学历的年轻人在就业市场中面临的压力、地方政府的财政压力以及外国企业的离开。为了扭转上述的部分问题,中国已重新开始接纳私人企业。不过,我们尚不明了中国政府会做出多少政策改变,又中国企业会如何应对这些政策改变。
因为既存关税、美中两国间日渐升级的紧张局势以及供应链在疫情中展现的脆弱,全球供应链正在重塑。由于改变任何一条供应链的成本都很高,这个改变的过程是缓慢的。
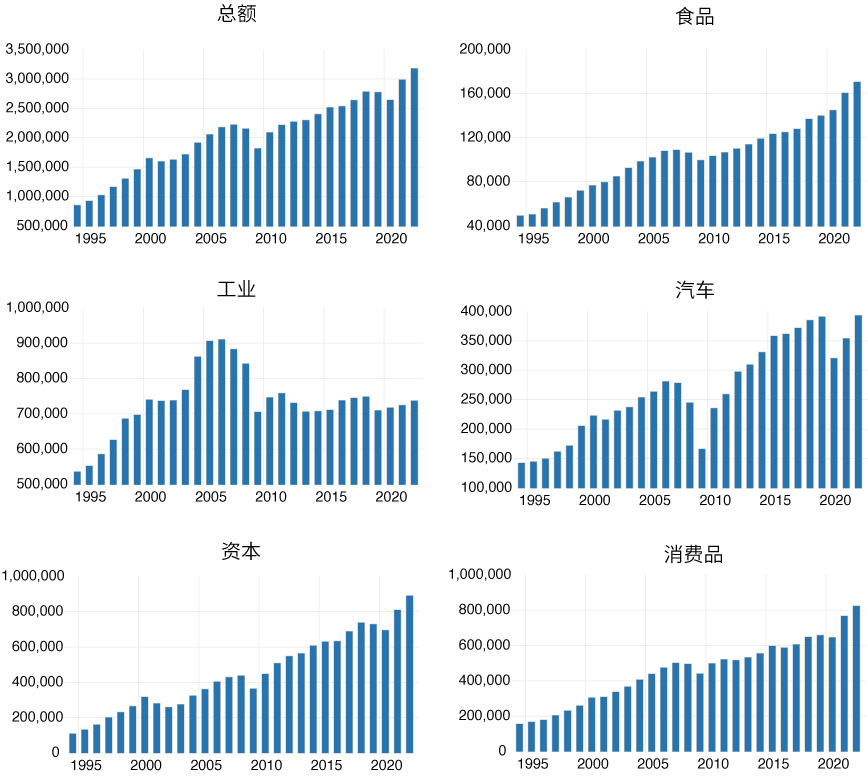
至于去全球化,虽然它正在发生,但目前没有在任何资料左证。图六显示美国自1995年从世界其他地方进口的实质商品。基本上总进口价值随着美国经济的扩张而增加, 2001年、2008年与2020年三个经济衰退时期除外。在五个进口类别中,只有工业原料(例如石油)没有呈现上涨的趋势。这反映了美国国内石油开采行业的发展,其目前已是世界第一。
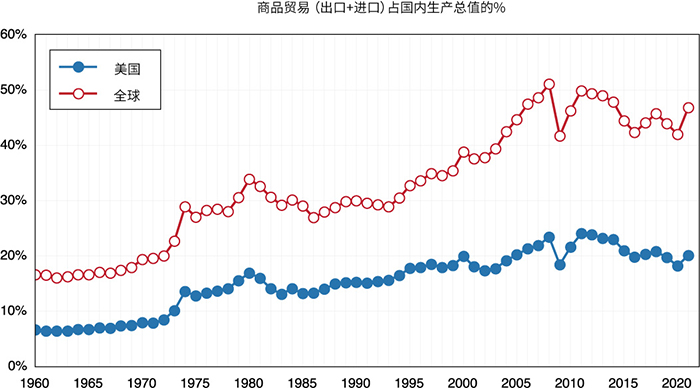
图七显示全球与美国商品贸易(出口加进口)价值占国内生产总值之百分比。我们可以看到国际贸易占总额的比例于2008年全球金融风暴左右达到高峰。其全球的国内生产总值占比来回浮动在45%,美国则是20%,且没有出现下跌的迹象。也就是说,目前为止,去全球化是反映在来源国的改变,而非透过在岸外包的真正去全球化。
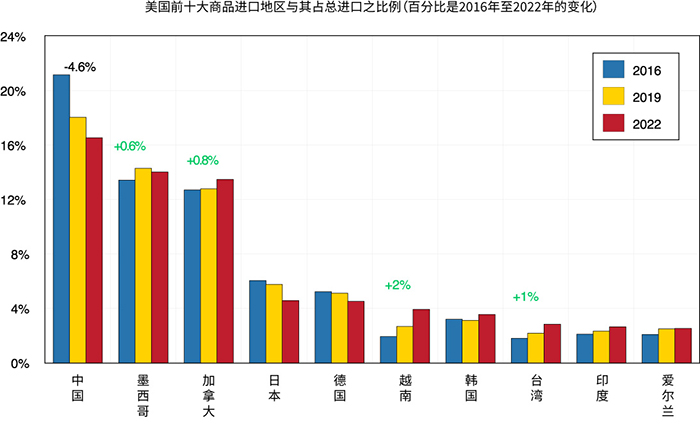
美国从中国进口的比例呈现逐年下降的趋势。图八显示2016年(贸易摩擦之前,蓝色柱状)、2019年(贸易摩擦发生一年后,黄色柱状)与2022年(全球疫情两年后,红色柱状)美国前十大商品进口地区以及它们占总进口的比例。虽然中国仍然是美国最大的进口贸易伙伴,它对于美国的重要性在2018年贸易摩擦开始后逐年下降。从2016年至2022年,美国自中国进口的比例减少了4.6%。美国自墨西哥进口的商品微微增加了0.6%,而从加拿大的进口则是增加了0.8%,剩下从越南、韩国、台湾、印度与爱尔兰的进口也都有增加。进口比例增加幅度最大的两个贸易伙伴则是越南(2%)与台湾(1%)。
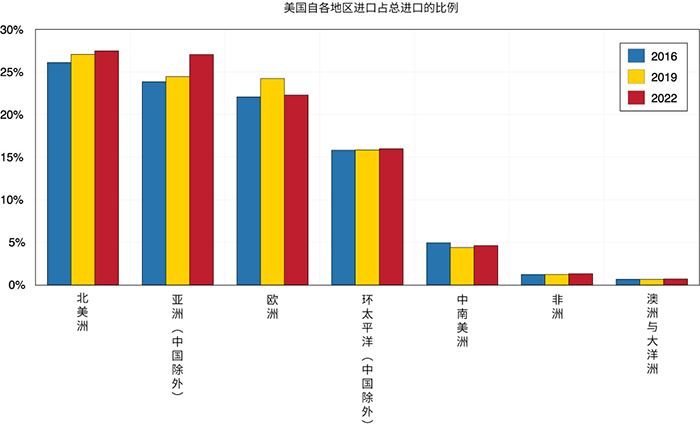
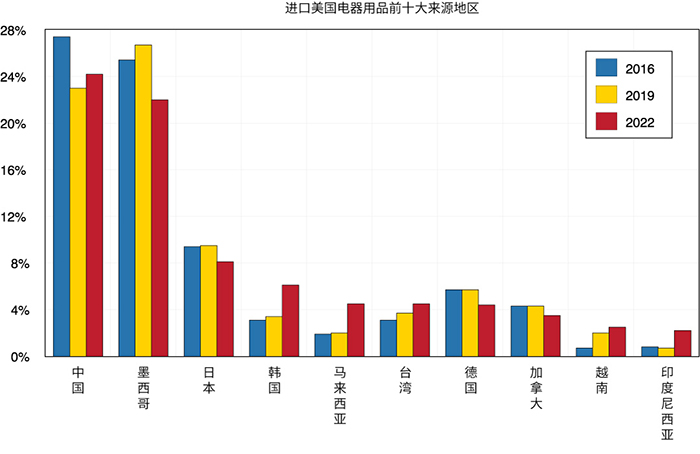
需要注意的是虽然美国从中国进口商品的比例减少了,但从其他亚洲地区的进口有显著成长(图九)。也就是说,现在有一股力量促使进口从中国分化至其他东南亚国家。亚洲依旧是美国重要的进口贸易伙伴。从过去几年美国与中国敌意、紧张与不信任升级下的友岸外包来看,这些显而易见。与此同时,美国从北美洲的进口出现缓慢的成长。这可能是因为远距离全球供应链的脆弱性而进行的近岸外包调整,但现在说什么都还太早。
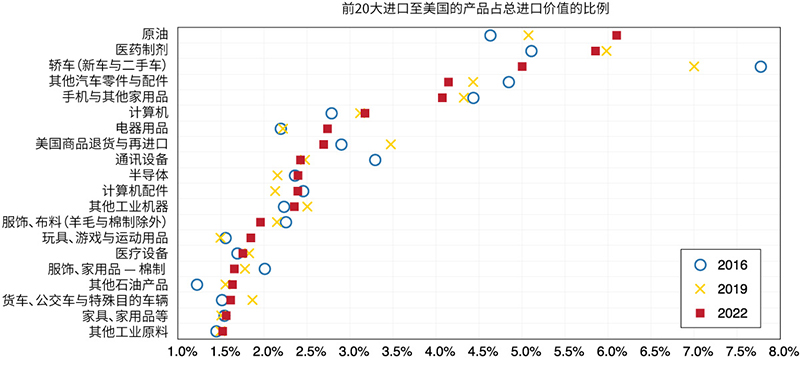
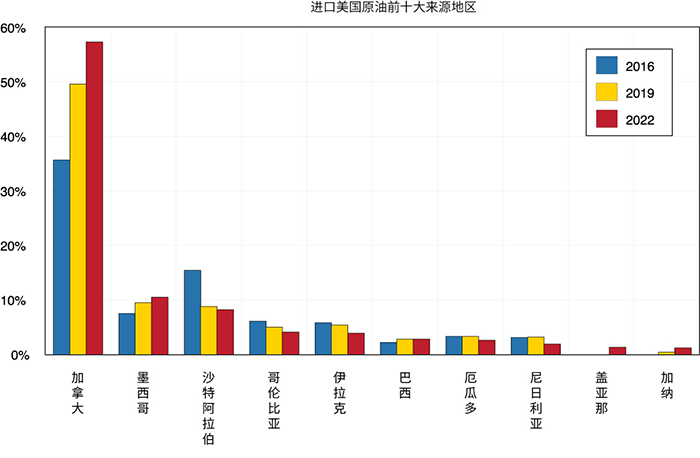
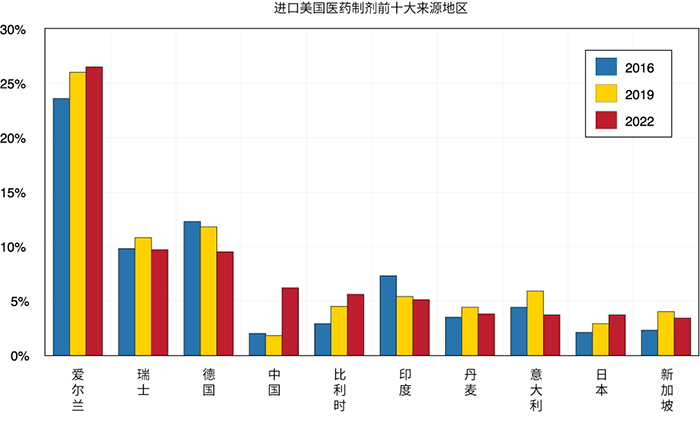
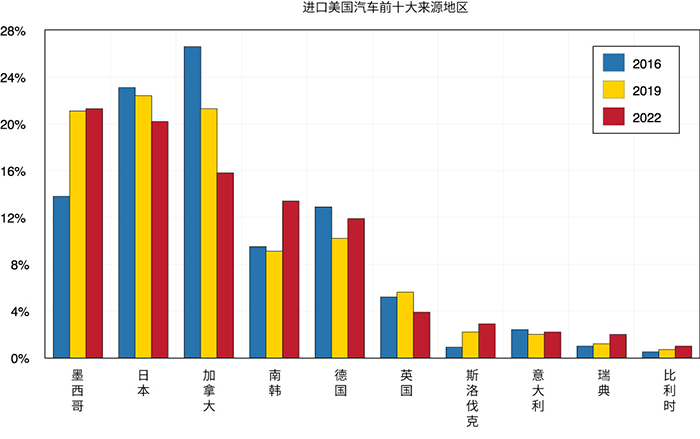
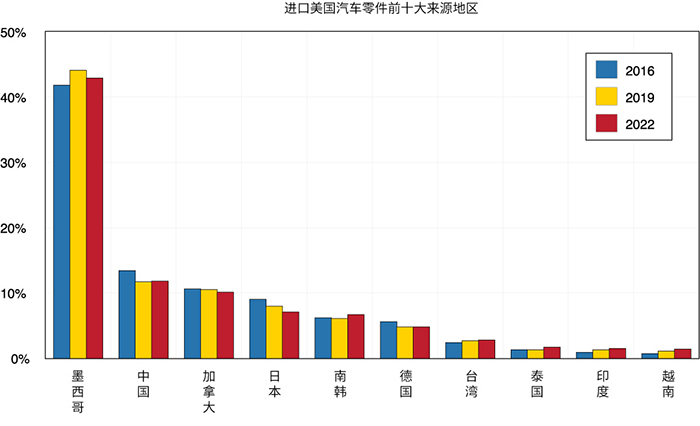
图十显示了2016年、2019年与2022年美国的前20大进口商品。我们可以看到2016年第一名的进口商品为轿车,但在2022年它跌到了第三名。这可能是因为以下两个理由。首先,疫情时出现了严重的芯片短缺,所以全球汽车减产。第二个理由则是美国国内汽车生产的增加,所以其对于进口车的依赖性降低。与此同时,美国的原油进口则是出现增加。这是因为疫情时生产的停止,且目前无法恢复到疫情前的生产水平以应对需求的迅速增加。随着最近国内生产的增加,这个趋势应该会扭转。美国进口的医药制剂,也就是活性药物成分(APIs),更是因为新冠疫苗的制造而大幅增加。
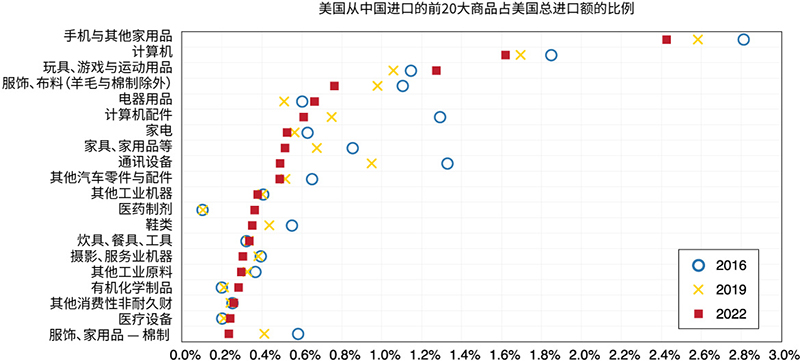
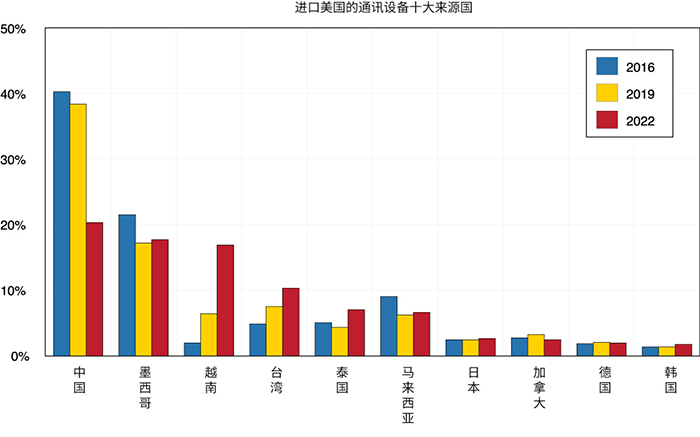
图十一展示了2016年、2019年与2022年美国从中国进口的前20大商品。2022年前四大的商品为:(1)手机、(2)计算机、(3)玩具及运动用品与(4)服饰。可以看到美国前两大进口商品的占比降低了。更重要的是,2016年从中国进口的第三大商品是计算机配件,但到了2022年,其占比大幅降低到了第六名。2016年的第四名为通讯设备,其在2022年也大幅降低到了第九名。我们认为这两个中国科技产品的排名出现了剧幅下跌是因为人们对信息安全与国家安全愈加地重视。
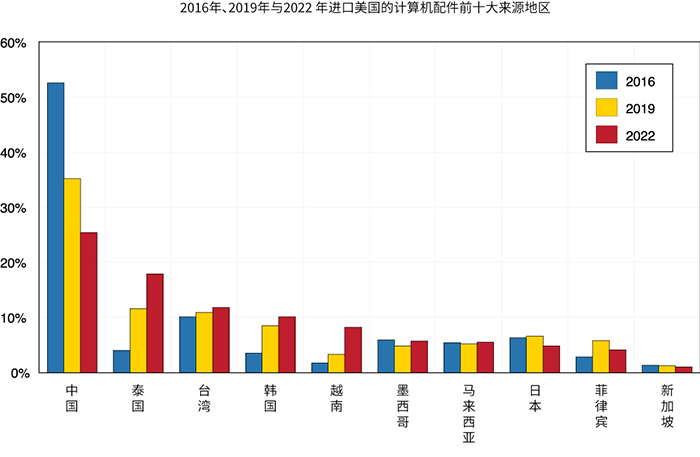
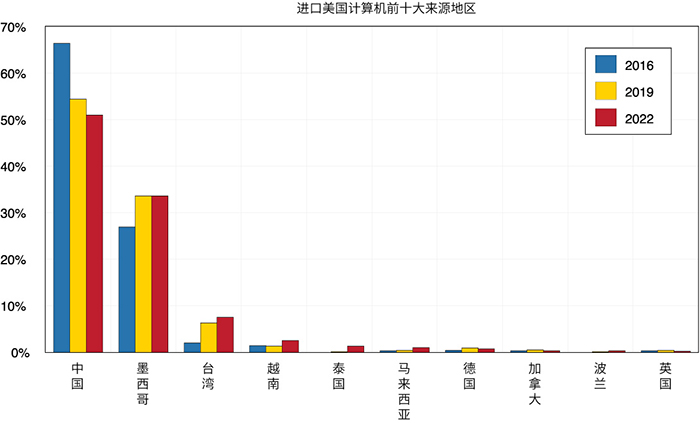
图十二列出2016年、2019年与2022年进口美国的计算机配件前十大地区。我们可以看到从中国的进口在2016年占全部计算机配件进口比例的53%,而在2022年时已迅速降至25%。同时,美国从台湾、韩国与越南的进口则是迅速增加,因为从这些较为友善的地区进口这些商品可以减轻对国家安全的疑虑。相似地,图十三则是列出2016年、2019年与2022年进口美国的通讯设备前十大地区。美国从中国进口这些设备的比例从2016年的40%降至2022年的20%。
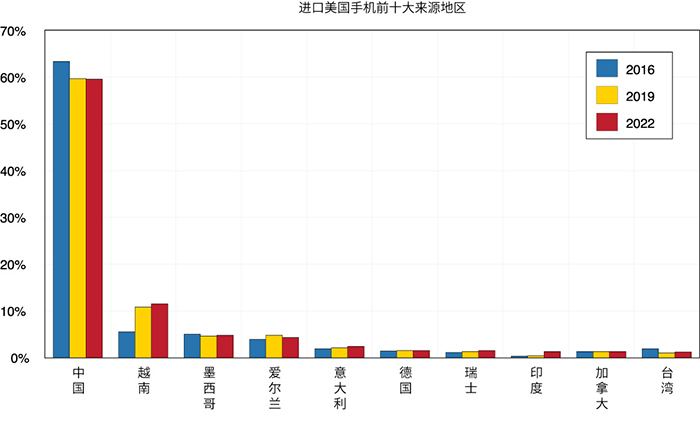
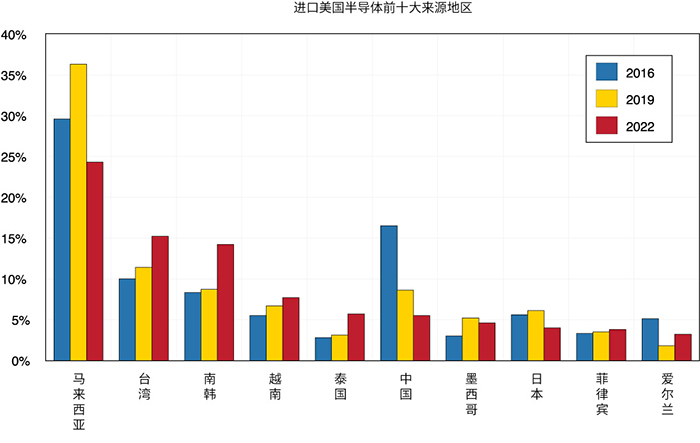
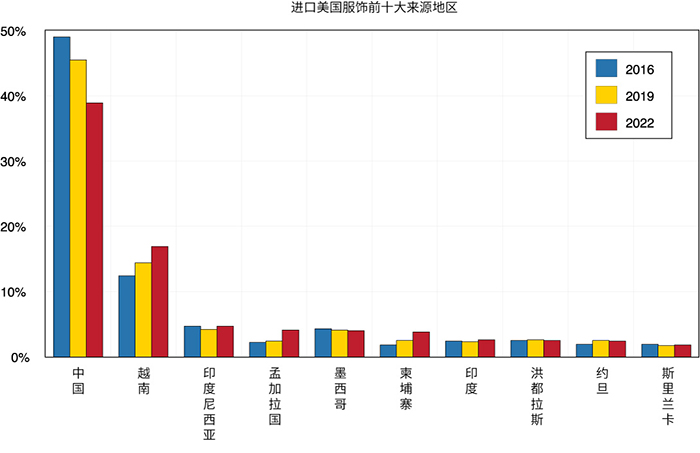
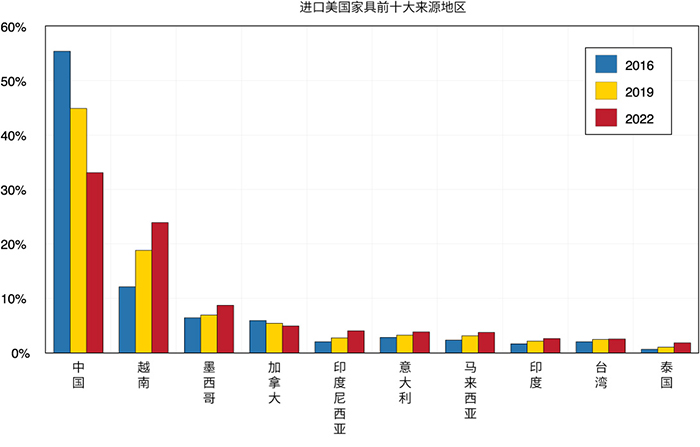
附录A列出了2016年、2019年与2022年进口美国的其他商品前十大地区。我们可以看到美国从中国进口的半导体占总半导体进口的比例从2016年的17% (排名第二)大幅降低至2022年的5%(排名第六)。至于服饰与家具,从中国进口的比例减少大多是因为中国生产成本的提升。虽然手机(包含热门的iPhone)的进口依旧大量依赖中国,2016年至2022年的跌幅也只是从64%至60%,但是我们预期手机生产对中国的依赖在未来也会减少。这可以从富士康,也就是苹果最大的制造商之一,宣布其将在印度投资七亿美元建设新的iPhone工厂看出来。
2023年为疫情过后的第一年,美国与中国皆需要面对经济上的困难与挑战。美国目前正面临继2008年后最严重的银行危机。联邦监管机构正在采取手段以重建存款人与投资人的信心。美联储则是在抉择的岔路口:较不激进的货币紧缩政策或是宽松的货币政策。我们还有好几个月才会知道真正被施行的政策是什么。然而,因为美国的通膨依然很严重,利率不太有可能降低。中国则是面临房地产贬值、银行债台高筑与外国企业与制造商撤出的严重问题。虽然我们预测中国的经济在接下来的几年还是会缓慢成长,北京也在做决定的关键时刻:是否应该按照写进二十大报告中的,依靠国企推进共同富裕,还是转向依靠私人企业来支持经济成长。这个问题也是需要过好几个月我们才会明朗化。
世界的两大经济体,美国与中国,会持续在战略上较量。美国众议院于2023年1月新成立了美国与中国共产党战略竞争特设委员会。此委员会在2月时举行了第一次听证会。委员会主席加拉格尔(Gallagher)在听证会上表示,美国与中国间的战略竞争是一场生死存亡之争, 关乎21世纪人们生活的样貌。展望未来,我们认为美国/中国2023年的经济关系会充满着不确定性,甚至会出现更多的冲突与限制。除此之外,过去几年间的脱钩行动将会继续, 并取决于地缘政治的政策实施和变化,脱钩或许会加速。
在国泰银行赞助出版的《美中经济报告2022》中,加州大学洛杉矶分校安德森经济预测中心(预测中心)提供他们对美中这两大世界经济体的当前与未来的分析及观点。
逾65年以来,预测中心一直是分析美国和加州经济的领先的独立经济预测机构。年度报告及定期更新侧重于影响美中之间投资行为与资金流动的相关事件。
本报告中的预测性陈述,是来自预测中心根据当时可获得的资讯,对美国及中国当前及未来经济状况的分析及观点。这些预测乃考虑到业界趋势与其他因素所作出的,且包含了风险、变数与不确定性。此资讯以概述方式呈现,并未宣称资讯完整。本报告中的资讯不应被视为采取特定行动的意见或建议,且并不考虑任何特定业务目标、财务状况或需求。
在此提醒读者不要过度依赖前瞻性陈述。报告发表后,预测中心不负责公开发表对这些前瞻性陈述的任何修订结果。尽管已谨慎准备预测资讯,实际结果可能会有正面或负面的实质性差异。预测与假设范例可能因预测中心控制以外的不确定性与偶发事件受到影响。
Jerry Nickelsburg在2006年时加入加州大学洛杉矶分校的安德森管理学院及安德森预测中心。自2017年起出任安德森预测中心总监。他也在工商管理硕士课程中教授经济学,关注企业预测与亚洲经济。他拥有明尼苏达大学的经济博士学位,并曾就读于维吉尼亚军校以及乔治华盛顿大学。他在经济学与公共政策有关的言论获广泛发表及引用。
William Yu在2011年以经济学家的身份加入加州大学洛杉矶分校安德森预测中心。他在预测中心主要负责的领域包括经济建模、预测与洛杉矶经济。同时也从事中国经济以及其与美国经济的关系研究与预测。他的研究主轴包括诸如时间序列计量经济学、数据分析、股票、债券、房地产与商品价格动态、人力资本与创新等广泛的经济金融问题。

