
在过去七年间,美中关系持续走下坡。面对美中关系可能进一步恶化的担忧,拜登总统和习主席于2023年11月在旧金山会面。这次会谈代表了对不断升级的紧张局势的重要暂停,甚至可能是逆转。是什么避免了这两个大国从战略竞争升级到全面对抗?
我们提出两个主要因素。首先,中国可能已经意识到中国经济并不像北京先前所认为的那样有韧性。在2008年全球金融危机之后,北京一直认为其中央控制的经济模式能比西方经济产生更优越的经济增长。在2020年和2021年,COVID-19大流行打乱了美国和西方的经济成长,但对中国造成的损害相对较小,增强了北京的信心。北京关于东升西降的论断获得了支持。然而,2022年中国实施的清零政策暴露出中国经济更大的弱点,也导致了经济停滞。在了解这些挑战和稳定经济的需求后,北京可能判断直接挑战美国的好处减少了。
其次,从美国的角度来看,2022年2月开始的俄罗斯-乌克兰战争以及2023年10月开始的以色列-哈马斯战争都是出乎意料且不欢迎的事件。这些事件加剧了美国对亚太地区冲突的厌恶情绪。为了避免与中国进一步的冲突,美国选择用更友好的方式对待美中关系。旧金山的会议成功地缓和了紧张局势,并在恢复军事通信和打击非法毒品等领域取得了进展。
在过去六个月间,美国和中国表现出了越来越多经济道路上的分歧。尽管经济衰退的警告不断,美国经济表现出韧性和卓越的经济增长,目前的就业数据显示,美国经济在2024年和2025年还有进一步的增长空间。考虑到强劲的经济和顽强的通货膨胀,2024年余下的时间内,美国通胀和利率的走向将会如何?相反,中国经济遭遇了多重挑战。北京能够及时实施有效政策,重振疲弱的中国经济吗?此外,在去风险化时代,国际贸易、投资和全球供应链将会如何发展?我们的报告详细探讨了这些紧迫的问题。
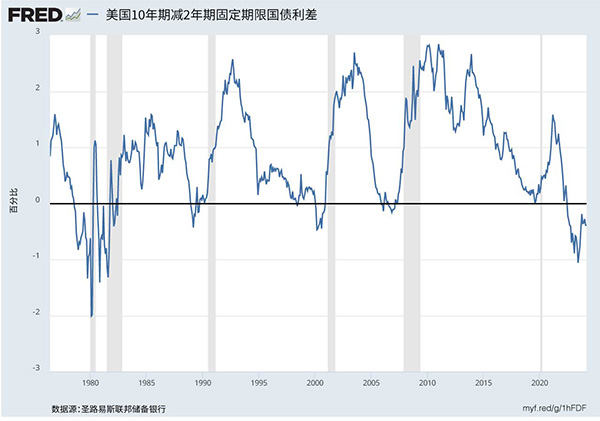
在过去五十年中,当美联储提高利率以遏制通胀和冷却过热的经济时,往往会导致美国经济衰退,尤其是殖利率曲线倒挂时(图一)。然而,当前的货币紧缩周期似乎有所不同,而且预期短期内不会出现衰退。这一次为何不同呢?虽然原因包括与国债市场和金融市场相关的不明因素,但是我们探讨的是实际经济因素。
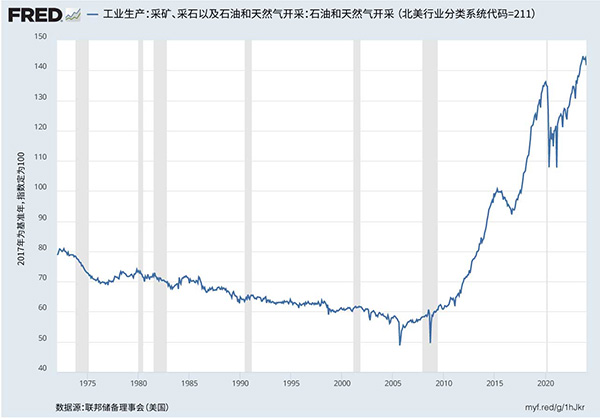
首先,受惠于先进的水力压裂技术,美国页岩油与页岩气生产正在复兴。美国的石油与天然气生产在COVID-19大流行期间受到了干扰,现在却已达到历史新高(图二)。也许会让有些人感到意外,但是美国现在是世界上最大的石油和天然气生产国。近期供应的增加对于避免重复1970年代的停滞性通胀至关重要。2022年俄罗斯入侵乌克兰后,西方对俄罗斯石油和天然气的制裁产生了类似于70年代的负面供应冲击,伴随着更高的能源产量;这种生产量的增加稳定了汽油价格,抵消了供应限制造成的通胀压力。
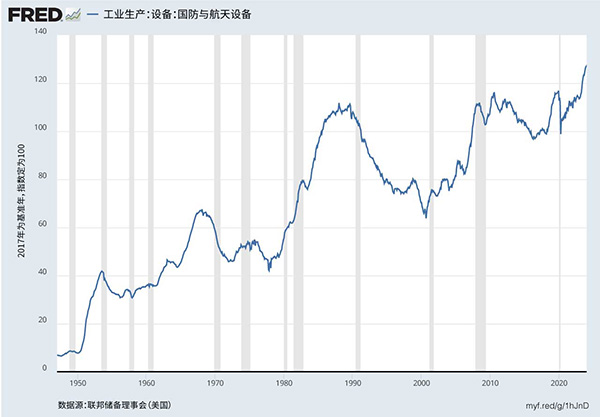
其次,位于乌克兰和加沙地带的冲突促使美国军事和国防装备产量在过去六个月内迅速增加,达到历史新高(图三)。这提振了美国GDP,联邦国防支出年增率从2021/2022年的0%左右上升到2023年的7%。
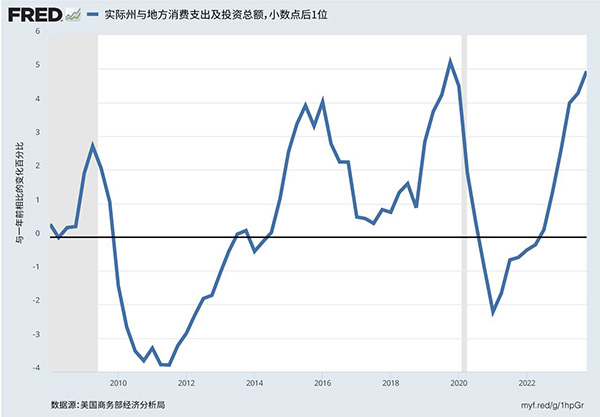
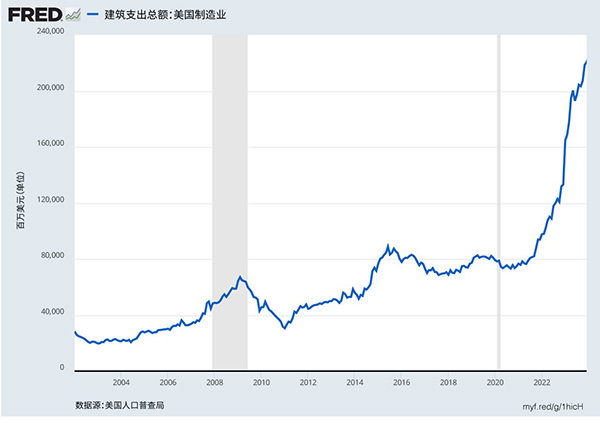
第三,2021年和2022年通过的重大法案,包括2021年的《基础设施投资和就业法案》(IIJA)、2022年的《芯片和科学法案》,以及2022年的《通胀削减法案》(IRA),已经产生了刺激性的财政支出,并且振兴了美国的制造业和供应链的韧性。其影响已经体现在各州和地方政府的消费与投资的年度增长上,增长了4%(图四)。此外,制造业的建筑支出也显著增加(过去一年增加了1200亿美元),这抵消了大流行期间因迁移减少和抵押贷款利率上升所导致的住宅建设投资下降(图五)。
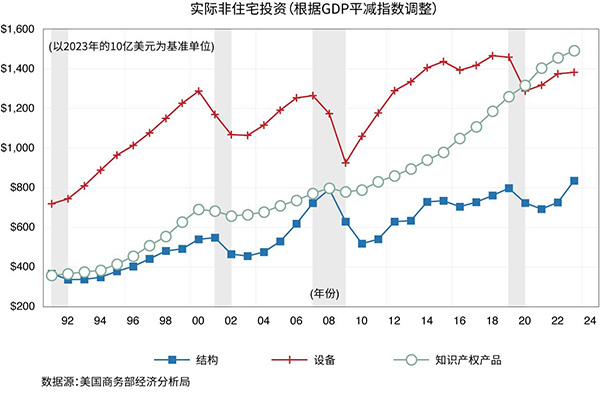
最后,尽管科技业裁员被广泛报道,我们不能忘记人工智能科技公司成长的重要性,以及科技领域整体持续增长的重要性。这两者都推动了股市屡创新高。图六显示了实际非住宅投资的三个主要组成部分,并根据GDP平减指数(以2023年十亿美元为单位)进行了通货膨胀调整后的数值。正如我们先前提到的,有别于2000年和2008年先前的紧缩周期,我们并未看到对设备(红线)和结构(蓝线)的总体资本投资出现下降。此外,我们看到对软件和知识产权产品(绿线)的投资持续增长。值得注意的是,这个较不受利率影响的组成部分,已成为非住宅投资中最大的元素。
照我们观察,这些因素是美国经济韧性的重要推手,且在短期内很可能保持积极发展或是维持现状。此外,我们预期重大的人工智能投资将在未来增强生产力。展望未来,我们预估经济将保持稳定的2.5%成长趋势。随着通胀率持续高于2%,以及经济按其潜力增长,我们预测美联储在2024年将维持远高于4%的短期利率。
尽管去年关于中国经济的负面新闻不断,包括消费需求疲软、制造业不景气和住宅建设急剧下降,但中国政府报告称,2023年国内生产总值(GDP)增长为5.2%。这一数字与大众的看法形成鲜明对比,使人质疑中国官方统计数据的准确性。事实上,任何展现以上特征的西方经济体几乎肯定会陷入衰退。加州大学洛杉矶分校安德森预测中心(UCLA Anderson Forecast)开发了一个简单的替代模型来评估中国的GDP增长1。该模型考虑了四个关键变量的年增长率。在2023年,这些数据分别是:能源消耗估计增长4.3%,二氧化碳排放增长2.5%,总贸易(出口和进口相加)为 -5.3%,以及房价增长为 -30%。根据安德森预测中心的模型,2023年中国的GDP增长率估计为0.8%,这一数字远低于中国官方的估计,且考虑到预测误差,与0.0%无显著差异。
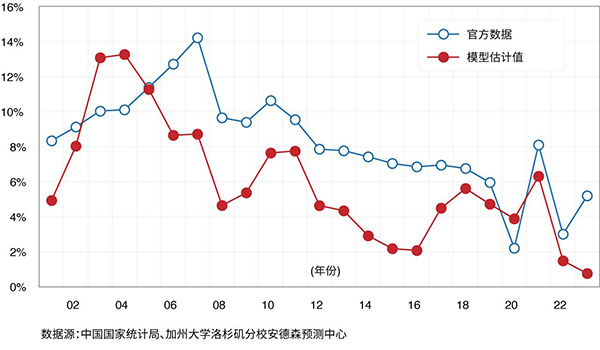
图七展示了我们的模型对中国历史GDP估计(红线)与中国国家统计局官方数据(蓝线)的比较。显然,与官方数据相比,我们的估计显示出持续较低的增长率。值得注意的是,我们的模型将2023年中国房价的变化率设为了-30%,反映了中国房地产行业的动荡,主要开发商如恒大正面临清算,碧桂园同样遭遇清算申请。然而,如果我们将中国官方的70个城市平均房价下降4%视为全国代表性数据,我们的模型推算中国的GDP增长为3.1%。尽管4%的下降可能是准确的,但它并不反映背后的市场价格。相反,中国政府采取干预措施,支持濒临倒闭的房地产公司,并将住宅单位从市场中撤出,掩盖了本该急剧下降的房价。
比较美国和中国的房地产ETF能够凸显中国房地产市场的困境。例如,2022年和2023年,先锋美国房地产ETF(VNQ)的增长率分别为-21%和+7%,而MSCI中国房地产ETF(CHIR)的增长率则分别为 -30%和 -37%。
图八展示了中国房地产泡沫及其后来爆破的规模。该图显示了从1995年开始可获得的数据,美国和中国的直接住宅投资占GDP的百分比。美国在过去一个世纪的住宅投资平均约占其GDP的4.5%(虚线),仅在1950年(6.9%)和2004至2006年期间(高峰时达到6.6%)在其房地产市场崩溃之前超过6%。虽然美国和中国的住房市场之间存在明显差异,如中国近年的城市化,但我们任意假设6%作为房地产泡沫的指标阈值。依此为衡量标准,中国的房地产市场自2006年以来,一直处于过度投资状态。以中国平均住房面积80平方米计算,自2011年以来,中国每年建造超过800万套住宅。截至2023年12月,中国仍有7300万套在建住宅。
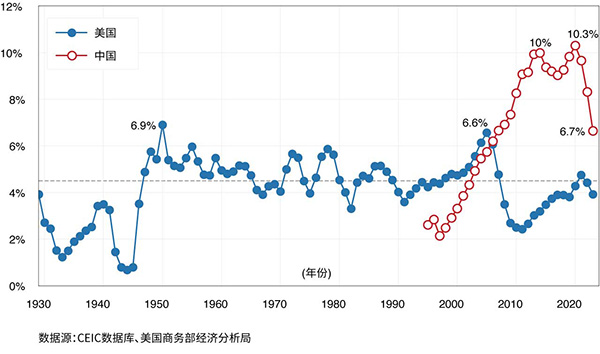
在美国房地产泡沫破裂的最初三年(2006至2008年),房地产投资占GDP的比例下降了3.1个百分点(从6.6%下降到3.5%)。中国房地产市场崩溃也出现了类似的模式,房地产投资占GDP的比例下降了3.6个百分点(从2020年的10.3%下降到2023年的6.7%),按平方米为计算的房屋动工数量从2019年的峰值下降了58%。以美元现值计算,这相当于下降了22%,按购买力平价计算,则下降了11.7%。对于美国来说,这种规模的下降在过去八十年里,六次伴随着衰退,仅两次未出现衰退。
其中一个例外是在1966年,当时为越南战争的准备造成实际国防开支在占GDP 9.6%的基础上增长了11%。预计中国将在占GDP 1.6%的基础上增加7.2%的国防开支,对经济的需求影响显著较小。第二个例外是2006年年底,房屋建设的崩溃最终导致了2008年初的经济大衰退。中国目前的住宅投资水平仍然很高,意味着可能会出现进一步的下降,如2006年美国那样。 这些数据加上中国人口减少的情况,令人怀疑中国的房地产危机能否在避免经济增长减缓或负增长的情况下得到解决。
与股市崩盘不同,房地产行业严重依赖债务,开发商和购房者通常通过贷款和杠杆融资。随着房价下跌,资产负债表的一侧价值减少,而另一侧的名义债务保持不变。这种失衡让借款人和贷款人难以维持清偿能力或恢复财务健康。因此,即使在低利率环境下,家庭、企业、地方政府和银行也会犹豫不决,不愿进行新的借贷或贷款活动。在房地产泡沫破裂后,日本花了近三十年,美国花了约八年时间才在财务上恢复。我们预测中国需要一个介于两者之间的恢复期,也许是十到二十年。
北京政府能否像过去那样进行干预,并重新点燃经济增长?这一次,前景似乎令人怀疑。自2008年全球金融危机以来,北京一直依靠财政刺激来振兴其放缓的经济,尤其是在2008/2009年、2011/2012年和2016-2020年期间。这些干预导致房地产泡沫日益扩大、基础设施网络不断扩张和制造设施产能过剩。
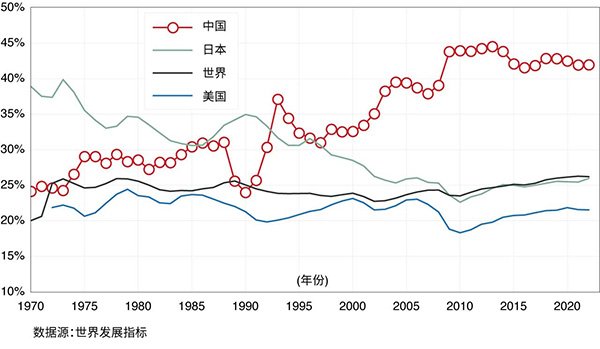
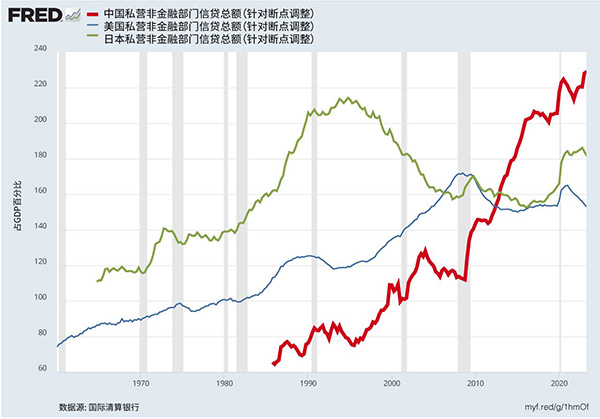
图九展示了美国、中国、日本和世界的投资(固定资本形成总额)占GDP的百分比。虽然房地产、基础设施和工厂投资全球的平均水平约为GDP的25%,但中国的投资率自2002年以来一直超过其GDP的35%,2008年后更是超过40%。如此不成比例的投资水平导致资源错配、回报减少甚至为负,以及债务负担加剧。中国的过度投资模式无论是规模还是持续时间都比1970年代和1980年代日本的状况更为严重。图十显示,自2008年以来,中国持续而广泛的过度投资加速了其私营部门债务的累积,在2023年达到GDP的228%。包括政府债务在内,中国的债务与GDP比率上升到307%,显著高于美国的253%和G20平均的248%。总之,中国持续的投资,尽管可能出现负回报和债务加剧,是不可长期持续的。
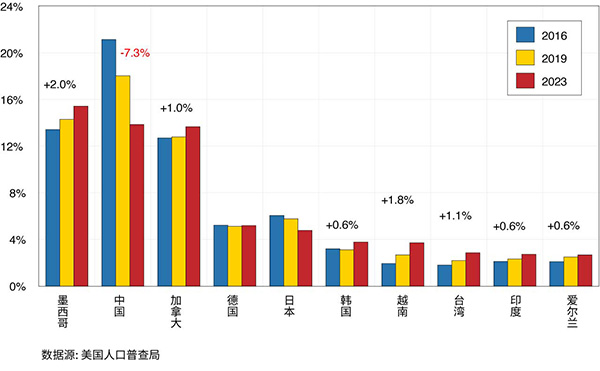
在先前的报告中,我们讨论了美中战略竞争的动态及随之而来的去风险化。本报告呈现了全球供应链正持续转型以及摆脱以中国为中心的贸易模式的证据。图十一突显了这一转变:在2016年(美中贸易摩擦之前),中国是美国的主要进口来源,占进口额的21%。到了2023年,这一数字下降至14%,减少了7.3个百分点。相反,从墨西哥的进口从2016年到2023年上升了两个百分点。现在,在近岸外包和《美墨加协定》(USMCA)的原则下,墨西哥已成为美国最大的进口来源。对中国的依赖减少,加上现有的关税,导致进口来源多元化到其他地区,如加拿大(从2016年到2023年增加了1%)、韩国(+0.6%)、越南(+1.8%)、台湾(+1.1%)和印度(+0.6%)。这种策略通常被称为“友岸外包”,是一个真实且持续的过程。 在中国方面,官方正式采取措施以国产软件替代西方软件,包括操作系统和应用程序。这将加速减少中国与西方之间的外国直接投资和服务贸易。
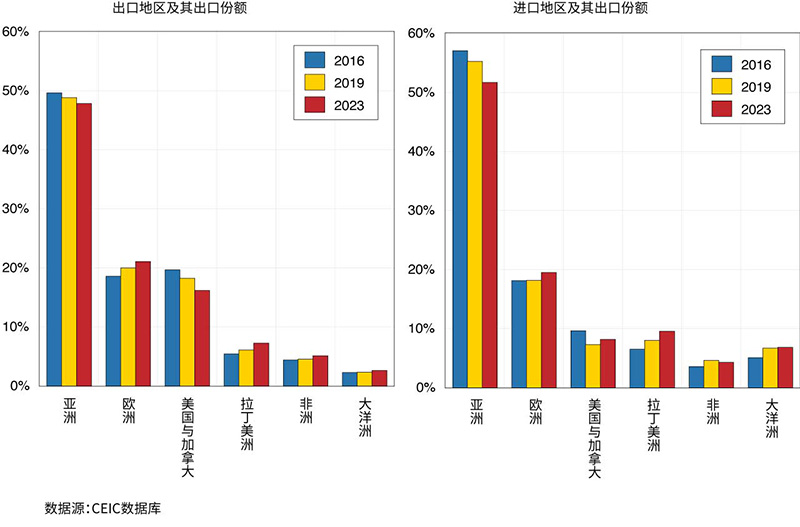
图十二提供了中国出口和进口地区变化的洞察,以及它们在2016年、2019年和2023年的各自份额。尽管中国对美国的出口份额有所下降,但美国仍然是中国最重要的出口市场和其贸易顺差的主要来源。目前,中国正积极寻求增加对欧洲、拉丁美洲和非洲的出口。由于中国商品生产过剩,贸易的紧张局势未来可能会升级。这在电动车(EV)和太阳能板行业尤其严重,因为这些行业的产量已经超出了国内市场的吸收能力。举例来说,欧盟委员会正在调查中国制造的廉价电动车是否存在因国家补贴而产生潜在的不公平优势,以决定是否实施报复性关税。
虽然图表中未有显示,但中国从俄罗斯的进口份额显著增加,从2019年的2.9%上升到2023年的5.1%。同样,中国对俄罗斯的出口也从2%增加到3.3%。随着俄罗斯因入侵乌克兰而受到西方制裁,中国增加了来自俄罗斯的能源进口并增加了商品和设备的出口。由于对俄罗斯的制裁短期内不会结束,这种中国贸易的转变预计将会持续。
总而言之,中国经济面临三大结构性挑战。首先,过度投资的后果以及房地产泡沫的破裂是根深蒂固的问题,需要较长时间来解决。其次,美国和中国之间不断加剧的战略竞争限制了中国接触西方先进技术的机会。这种紧张局势导致外国对中国的直接投资显著减少,许多制造商将其业务转移到其他地区。第三,在习主席的统治下,中国经济模式更加趋向由国家控制。这一转变加上北京在政策、监管和控制措施上的不确定性,使得企业、个人和资本市场变得谨慎,并越来越多地搬离中国。这些挑战不仅仅是短期或周期性的;它们预示着中国未来十年的经济前景可能十分黯淡。
在第二次世界大战后的四十年间,日本的经济增长被视为计划经济的奇迹。其经济主要是由高储蓄率支持对现代资本财货的大量投资所推动。但随着时间的推移,这些投资的回报下降了,储蓄流入了房地产泡沫。泡沫破裂后,日本陷入了缓慢增长的时代,在后来被称为「失落的十年2」。如今,中国也处于类似的境地。从1980年代中期起,高储蓄率推动了一段显著的经济增长期。投资回报下降、房地产泡沫以及人口减少的情况都惊人地相似。若不想2020年代成为失落的十年,中国必须找到一种方式激发创新和增长,即使与曾经通过出口为中国带来繁荣的国家(包括美国)的经济联系减少。即便正在与中国经济脱钩,美国经济仍在带领发达国家的经济增长。随着差距的扩大和中国感到越来越与西方孤立3,经济机遇的新现实将直接影响到两国之间的投资和贸易。
在国泰银行赞助出版的《美中经济报告2022》中,加州大学洛杉矶分校安德森经济预测中心(预测中心)提供他们对美中这两大世界经济体的当前与未来的分析及观点。
逾65年以来,预测中心一直是分析美国和加州经济的领先的独立经济预测机构。年度报告及定期更新侧重于影响美中之间投资行为与资金流动的相关事件。
本报告中的预测性陈述,是来自预测中心根据当时可获得的资讯,对美国及中国当前及未来经济状况的分析及观点。这些预测乃考虑到业界趋势与其他因素所作出的,且包含了风险、变数与不确定性。此资讯以概述方式呈现,并未宣称资讯完整。本报告中的资讯不应被视为采取特定行动的意见或建议,且并不考虑任何特定业务目标、财务状况或需求。
在此提醒读者不要过度依赖前瞻性陈述。报告发表后,预测中心不负责公开发表对这些前瞻性陈述的任何修订结果。尽管已谨慎准备预测资讯,实际结果可能会有正面或负面的实质性差异。预测与假设范例可能因预测中心控制以外的不确定性与偶发事件受到影响。
Jerry Nickelsburg在2006年时加入加州大学洛杉矶分校的安德森管理学院及安德森预测中心。自2017年起出任安德森预测中心总监。他也在工商管理硕士课程中教授经济学,关注企业预测与亚洲经济。他拥有明尼苏达大学的经济博士学位,并曾就读于维吉尼亚军校以及乔治华盛顿大学。他在经济学与公共政策有关的言论获广泛发表及引用。
William Yu在2011年以经济学家的身份加入加州大学洛杉矶分校安德森预测中心。他在预测中心主要负责的领域包括经济建模、预测与洛杉矶经济。同时也从事中国经济以及其与美国经济的关系研究与预测。他的研究主轴包括诸如时间序列计量经济学、数据分析、股票、债券、房地产与商品价格动态、人力资本与创新等广泛的经济金融问题。

