
As we enter the third year of the pandemic, the global economy faces several challenges and uncertainties. First, the COVID-19 variants Alpha, Delta, and Omicron arrived one after another suggesting that there may be future variants that could cause more economic disruption. Second, the inflation monster has come alive in the U.S. on strong economic growth and inflation is cooling in China on weak economic growth. As a response, the Federal Reserve is likely to begin a tightening monetary cycle in March, while the People’s Bank of China is moving in the opposite direction. This has important implications for effective exchange rates and the pattern of trade in the coming year. Will rising interest rates contain inflation and keep the economic expansion on track in the U.S.? Will falling interest rates in China spur economic growth? And third, the abrupt increases of demand in the U.S. might have caught global producers and suppliers off guard. Will global supply chains capacity soon expand and catch up with American demand? In this report, we answer these questions and review the U.S. and Chinese economies and global supply chains during this time of pandemic and economic turbulence.
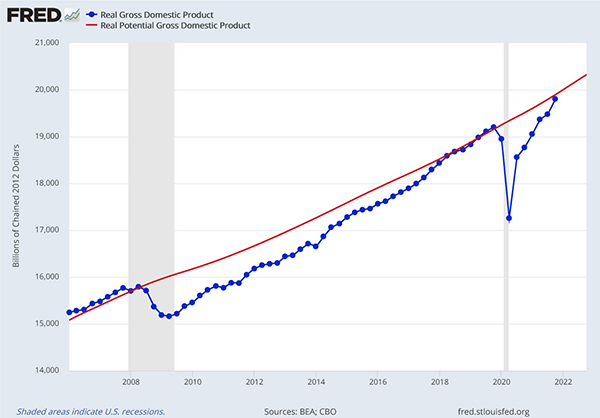
The U.S. economy grew at a rapid 6.9% annual rate in the fourth quarter of 2021. For the whole year 2021, U.S. real GDP grew at 5.7% following a decline of 3.4% in 2020. This swift recovery and growth resulted in the U.S. economy’s return to its pre-pandemic peak in the second quarter of 2021. By the end of the year, GDP also returned to its longer-term trend (red line in Figure 1). This strong economic growth, unfortunately, came with higher inflation.
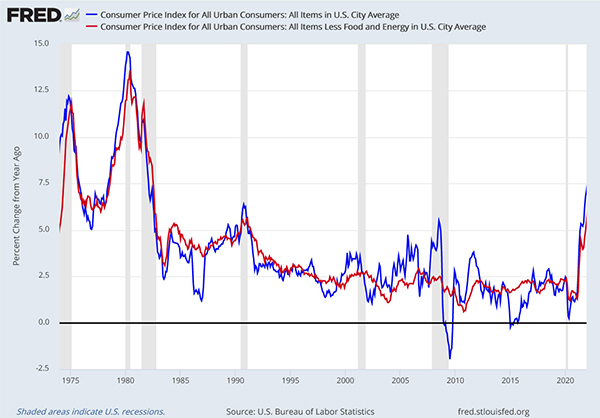
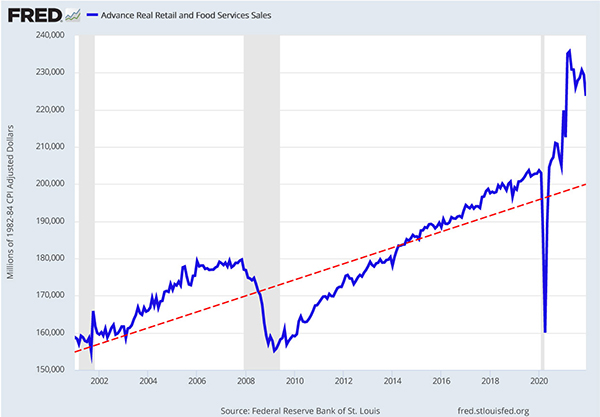
In December 2021, the headline inflation rate rose to 7.1% year-over-year, the highest in four decades. The core inflation rate, which excludes volatile energy and food prices, rose 5.5% year-over-year, the highest in three decades. The inflation rate is much higher than many forecasters, including the Fed and ourselves, predicted a year ago. What went wrong? There is one short answer: demand has far exceeded supply! The surge to 8% to 11% above historical trends in real retail and food services sales in the U.S. provides an example (red dash line in Figure 3). Some of the driving forces of the current inflation are: (1) higher disposable income from the fiscal stimulus of 2020/21, (2) increased demand for larger homes due to the trend towards work-from-home, (3) higher spending in retail stores and on restaurant meals after a time of consumer restraints, and (4) higher spending due to a wealth effect from rising asset prices including stocks and homes.
Though the demand for goods and services has risen, key sectors have yet to respond with sufficient increases in supply. American oil and natural gas production is still 8% below its pre-pandemic peak, and vehicle production is still 5% below its pre-pandemic peak. In other sectors, supply increases have been constrained by a labor force that is still 2% below its pre-pandemic peak.
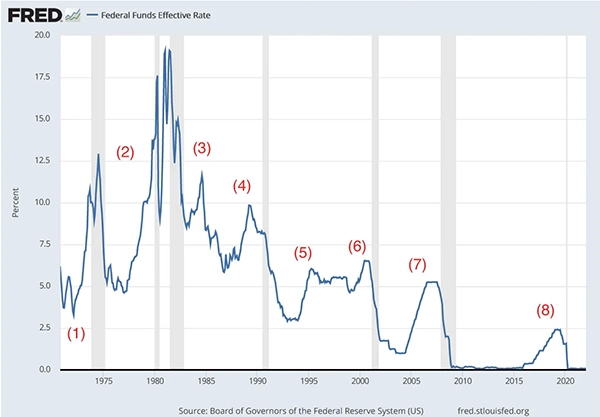
At the January 26 press conference, Federal Reserve Chair Jerome Powell said that the Fed will end its asset purchases by March, and it is likely to raise interest rates at that time. Powell emphasized that the Fed continues its commitment to price stability and indicated that a cycle of tightening of monetary policy is coming. What will happen for the U.S. economy when the Fed starts to tighten? For a guide from history, we examine how the economy reacted in the past few tightening cycles.
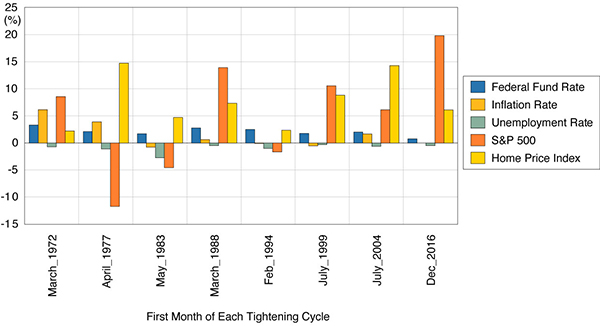
Figure 4 shows eight tightening cycles with Federal Fund Rates since 1970. In Figure 5, each of those cycles is displayed with key economic indicators for the 12 months following the start of the cycle. For example, the first tightening cycle started in March 1972. From February 1972 to February 1973, the Federal Funds rate was raised by 3.29 percentage points, the inflation rate increased by 6.1 percentage points, the unemployment rate declined by 0.7 percentage points, the S&P 500 stock market index rose 8.6%, and the nominal home price index increased by 2.1%.
During the first year of the eight cycles studied, interest rates increased between 0.75 percentage points (2016) and 3.3 percentage points (1972). Inflation rates changed from -0.8 to +6.0 percentage points. Unemployment rates declined in all cycles. In equity markets, stock prices increased five times and decreased three times. Nominal home prices increased in all cycles. Historical evidence suggests that the promised tightening of monetary policy to begin in March of this year is unlikely to cause a recession by itself.
In terms of risks to our U.S. economic forecast, the biggest one is still the risk of new disruptions due to the ongoing COVID-19 pandemic. The assumption used in constructing our economic forecast is that the economic impact of future COVID-19 variants will lessen over time. However, this is an assumption, not a forecast. If this proves not to be the case, the forecast presented here is too optimistic.
China’s GDP grew by 8.1% in 2021, according to its National Bureau of Statistics (NBS). This growth rate is considerably higher than many forecasters’ predictions.1 The largest reported drivers of the 2021 growth were China’s manufacturing and export sectors. Given the policy response of the People’s Bank of China (PBoC) to current economic conditions, this number seems to hide significant weakness in the Chinese economy.
We developed a simple model to provide a contrasting estimate.2 The model uses three key variables: annual growth rates of energy consumption/electricity production, CO2 emissions, and total trade (exports plus imports). For details, see the Appendix in this report. These were combined with data from the 13 largest economies in the world to calibrate the model.
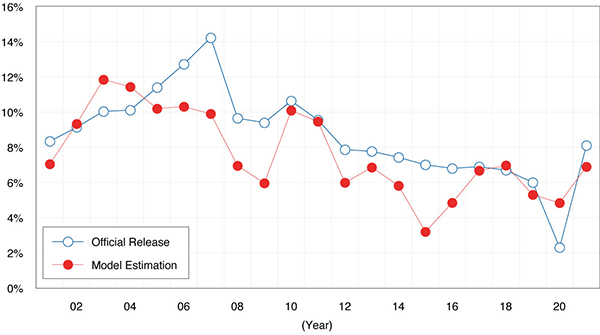
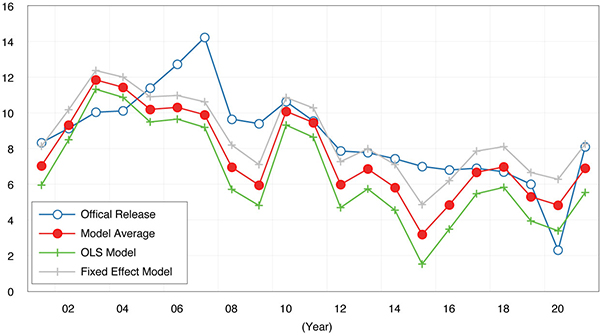
Based on our model, China’s GDP growth was 6.9% in 2021, lower than NBS’s 8.1%3. Figure 6 shows our model estimation of historical China GDP (red line) vs. the NBS’ official numbers (blue line). While both series show a similar downward sloping trend beginning in 2007, our estimates are mostly below the official numbers and the higher volatility is more like that experienced in other large economies.
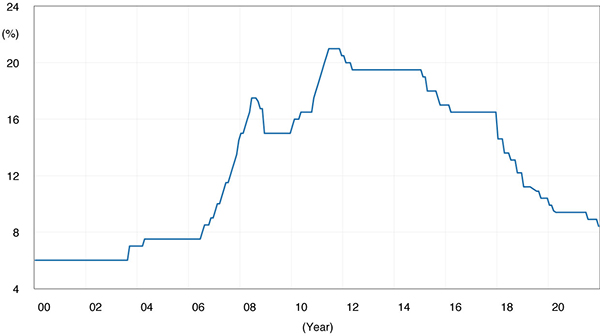
In the short run, China is facing economic headwinds. One simple indicator is that in December 2021, the PBoC reduced the reserve requirement ratio for banks by 0.5 percentage point to 8.4%, injecting about $188 billion into the financial system (Figure 7). This was the second time they have taken this action since July 2021. The PBoC’s move was to stimulate an economy that has been dragged down by a slump in the property market. While we don’t know if this is proactive and based on a forecast for a slowing economy or in response to the implosion of residential construction finance, it is suggestive that the 2022 economic growth in China will be significantly below our estimates for 2021.
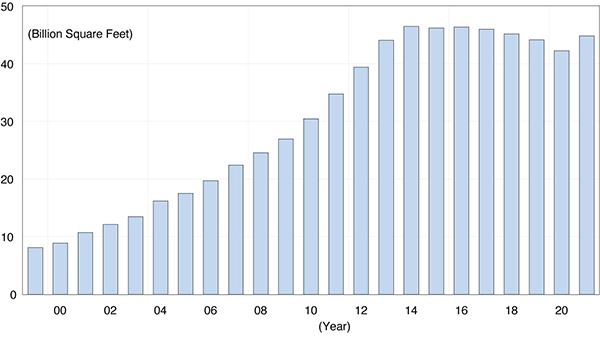
To illustrate the difficulty of China having sustained high economic growth consider China’s property market. Evergrande, China’s second largest property developer, is on the brink of bankruptcy. It has $300 billion in financial obligations and has been selectively defaulting on its debts. The business model that caused this problem for Evergrande is not unique, and it is indicative of a nationwide over-leveraged development model. As a result, China has significant over-built real estate markets with a heavy debt overhang. Figure 8 illustrates this. In 2021, China completed 44.8 billion square feet of commercial and residential buildings. That is almost nine times that of the U.S. at five billion square feet. In fact, over the past eight years, China has built more new space than the U.S. existing commercial and residential square footage. While the Chinese population is four times larger than the U.S. and China has been growing faster than the U.S., this level of building has been driven by economic policy rather than market fundamentals. To avoid recessions, Chinese economic policy has induced additional development and as a consequence, the supply of property has now exceeded demand. This real estate bubble and associated bad debt are, with zero tolerance COVID policy, the biggest current risks to the Chinese economy.
A major theme of the 14th Five-Year Plan is to build China into a self-reliant and innovation-driven technology and manufacturing powerhouse in response to U.S. export restrictions on certain high-tech components and products. To be specific, China’s industrial policies are to encourage more manufacturing and less real estate and entertainment. China’s economic planners believe the former will enhance China’s competitiveness while the latter are counter-productive and speculative.
In the long run, we forecast a continued slowing down of China’s economic growth. Why? In its 14th Five-Year Plan for 2021 to 2025, China prioritized the “quality of growth” rather than the “quantity of growth.” If implemented, it could mean investments in the past with high but unequal returns and those with high pollution content will be reduced. New investments will have less focus on the rate of return and more on their contribution to a “shared prosperity.” Regardless of the societal benefit claimed in the 14th Five-Year Plan for this pivot, it will naturally lead to slower economic growth.
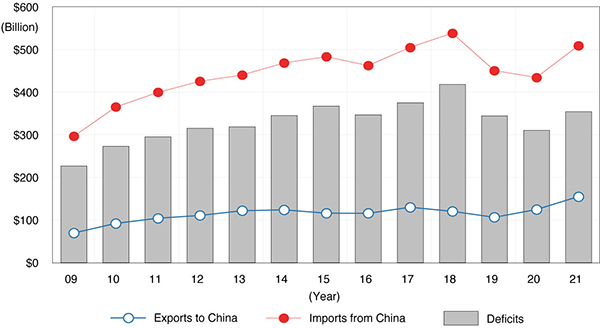
At the two-year anniversary of the U.S.-China Phase I trade agreement, it is time to examine compliance and the impact on trade. Figure 9 shows the U.S.-China merchandise trade amounts. The red line is U.S. imports from China and the blue line is U.S. exports to China. The bar is the U.S. trade deficit with China. U.S. goods exported to China increased in 2020 to a total of $124 billion and again in 2021 to an estimated $155 billion. U.S. imports from China have also increased to a 2021 total of $509 billion. This is after two years of declines following the start of the U.S.-China trade war in 2018. The trade deficit reached $354 billion in 2021, higher than in 2019 and 2020, but lower than the record $418 billion of 2018.
According to the agreement4, China purchases of goods and services from the U.S. was to increase to $310 billion in 2021. U.S. service exports to China are estimated5 to have been $38 billion in 2021. Adding goods and services together, U.S. exports totaled $194 billion in 2021, approximately 62% of the agreement level. In 2022 China will once again be importing Boeing 737-Max airplanes. Even though that will narrow the gap somewhat, it will be marginal.
It is hard to predict whether there will be another round of trade discussions leading to a Phase 2 agreement. However, in light of the above data, the likely outcome is the status quo, the theme of our 2021 annual report. Though there are some who advocate the end of the tariffs, there is in fact little popular support for U.S. removal of the current tariffs on China. Moreover, non-tariff barriers to trade on the importation of goods thought to be important for national security and the health of the U.S. economy are being erected.
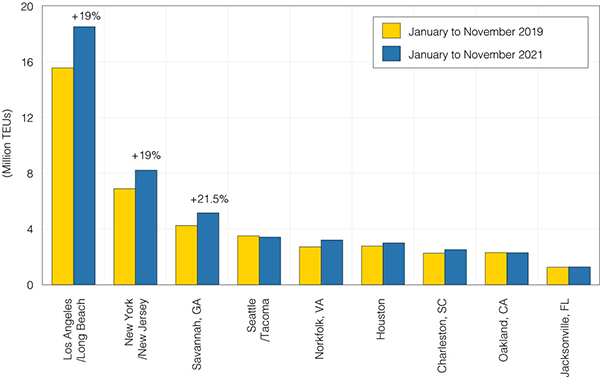
What is going on with global supply chains? How did the supply chain bottleneck happen? Figure 10 shows the total volume of exports and imports processed by the top nine seaports in the U.S. for the first 11 months of 2019 and 2021. The ports of Puget Sound, Oakland and Jacksonville are processing cargo at 2019 volumes and all others have experienced an increase in cargo handled. The top three seaports, Los Angeles/Long Beach, New York/New Jersey, and Savannah have seen cargo volume increases of more than 19%. These data are for containers that have moved between ship and dock and do not capture those on ships waiting to unload nor those on the dock waiting to be moved to distribution centers and bonded warehouses. The supply chain bottleneck at the ports is then a surge in American demand rather than a breakdown unloading cargo.
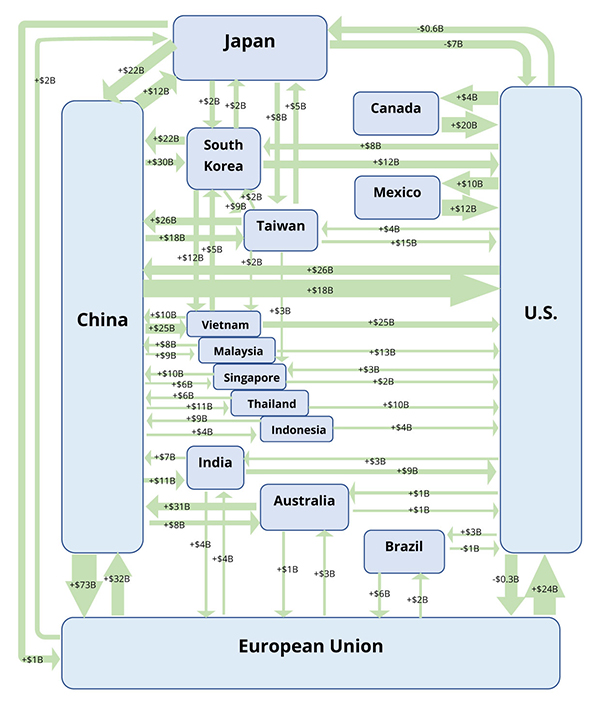
Figure 11 illustrates a snapshot of global supply chains. The dollar amount in the green arrows is the change in the value of merchandise trade between the first nine months of 2019 and that of 2021. By and large, nominal global trade (not adjusted for inflation) was higher in 2021 than in 2019. U.S. exports to China increased $26 billion and Chinese exports to the U.S. increased by $18 billion. The significant contraction was with Japanese exports to the U.S. Japanese exports of automobiles were constrained by another supply chain issue, capacity in the manufacturing of chips. The basic message is that despite the disruption of the past two years and the move to more onshoring of manufacturing, global supply chains are still expanding.
Facing high inflation, the U.S. is entering a tightening money cycle. History tells us that during the first year of interest rate hikes, the economy will continue to expand. Once the COVID-19 pandemic abates sufficiently, the U.S. economy will experience robust growth. In contrast, China will face many challenges and headwinds as it seeks to deleverage its debts, stabilize its real estate markets, and pivot to the 14th Five-Year Plan. The diverging paths of the two economies will increase the U.S. trade deficit with China in spite of the Phase 1 Agreement. This will make it difficult for U.S. policy makers to advocate for an ease in trade restrictions now in place. Nevertheless, overall trade will continue to increase as economies around the world grow and the current economic expansion continues.
The U.S. and China, two great powers and the largest world economies, continue to be in competition, particularly in the fields of geopolitical influence and technology. Looking forward, we predict the U.S./China economic relationship of 2021 will be the status quo for 2022. The decoupling of the past few years will continue, but supply chains are difficult and expensive to uncouple and therefore it will be at a relatively slow pace.
For years, many have doubted the accuracy of official statistics regarding China’s economy, in particular those that measure its GDP growth. We developed a simple, consistent, and alternative measurement of China’s real GDP growth. Unlike typical national GDP accounting, which computes hundreds of GDP components, our simple model uses only three variables: (1) energy consumption, (2) CO2 emissions, and (3) international merchandise trade amount.
The reason for this seemingly over-simplified method is twofold. First, as we doubt the quality of China’s GDP numbers, we also doubt many other Chinese official economic variables, on which the traditional and comprehensive method would depend. The more data from China we use, the more noise might enter the estimation. We assume that these three variables are more objective and reliable due to their straightforward collection and measurement, and they are also more easily observed and validated by international agencies. Second, in contrast to Chen et al. (2019)7’s method that tried to dissect detailed local historical data to estimate a more objective Chinese GDP, we wanted to build a measurement that is usable in real-time. Therefore, the timing and availability of the model inputs are important.
To estimate the model’s coefficients, we use the annual growth rates of these three variables from 2001 to 2019 from 10 countries: Australia, Brazil, Canada, Germany, India, Japan, Russia, South Korea, U.K., and the U.S. These are among the 13 largest economies in the world, including developed, emerging, and developing countries. The model variables are as follows:
We also tried a variable, foreign direct investment growth, but it is not significant.
As shown in Figure A, our model is an average (red line) of two models: (1) pooled OLS model, which uses input data without China (green line). (2) country fixed effect model, which uses input data including China (gray line). This model allows some unobservable and unique characteristics to explain each country’s average growth rate rather than using a single growth rate for all the sample countries.
If we look at other variables, e.g., global oil prices, real estate prices in China, credit growth in China, etc., they all indicate there was significant slowdown of the Chinese economy in 2015 and 2016. While we cannot see this from China’s official numbers, we do see it in our model. In conclusion, while this model is still is still a work in progress, in its current form it is a more reliable estimator of the state of the Chinese economy.
In the U.S.-China 2022 Annual Economic Report, sponsored by Cathay Bank, UCLA Anderson Forecast provides its view of economic analysis and perspective on the current and future outlook relating to the two largest economies in the world — the United States and China.
UCLA Anderson Forecast has been the leading independent economic forecast of both the U.S. and California economies for over 65 years. The annual report and periodic columns focus on current topics affecting investment flows and associated economic events between China and the United States.
This report includes forecasts, projections and other predictive statements that represent UCLA Anderson Forecast’s economic analysis and perspective on the current state and future outlook of the economies of The United States and China based on then available information. These forecasts take into account industry trends and other factors, and they involve risks, variables and uncertainties. This information is given in summary form and does not purport to be complete. Information contained in this report should not be considered advice or recommendation for a particular course of action and does not take into account any particular business objectives, financial situation or needs.
Readers are cautioned not to place undue reliance on the forward-looking statements. UCLA Anderson Forecast does not undertake any obligation to publicly release the result of any revisions to these forward-looking statements after the date of this report. While due care has been used in the preparation of the forecast information, actual results may vary in a materially positive or negative way. Forecasts and hypothetical examples are subject to uncertainty and contingencies beyond the control of UCLA Anderson Forecast.
Jerry Nickelsburg joined the UCLA’s Anderson School of Management and The Anderson Forecast in 2006. Since 2017 he has been the Director of The Anderson Forecast. He teaches economics in the MBA program with a focus on Business Forecasting and on Asian economies. He has a Ph.D. in economics from the University of Minnesota and studied at The Virginia Military Institute and George Washington University. He is widely published and cited on issues related to economics and public policy.
William Yu joined the UCLA Anderson Forecast in 2011 as an economist. At Forecast he focuses on the economic modeling, forecasting and Los Angeles economy. He also conducts research and forecast on China’s economy, and its relationship with the US economy. His research interests include a wide range of economic and financial issues, such as time series econometrics, data analytics, stock, bond, real estate, and commodity price dynamics, human capital, and innovation.

