
Over the past decade, the U.S. gradually realized that China’s growth and prosperity did not lead to increased liberalization as anticipated. Instead, China has demonstrated diverging interests and values from those of the U.S., including trade norms, human rights, geopolitical balance, Covid-19 responses, the Hong Kong Sino-British Joint Declaration, and Russia’s invasion of Ukraine. Consequently, the U.S. shifted from a forty-year strategic engagement approach to one of strategic competition.
A prime example of this strategic shift is the turn towards supply chain resilience. While China-centric global supply chains and manufacturing hubs provided extremely efficient just-in-time inventories in the post-Cold War period, they displayed fragility and significant risks to economic and national security, notably with medical devices during the pandemic and in high-tech sectors like communication and semiconductors. Our report highlights the evolution of international trade and risks in recent years.
Given the reasons stated, the U.S.-China economies are slowly decoupling. There’s concern that if this persists, it could result in economic stress in China, potentially inducing aggressive military actions in Asia Pacific. To avoid this dire outcome, “De-risking” was issued by the U.S. Treasury Department in May 2023 as a more appropriate guiding principle for U.S.-China relations than “Decoupling.” The term “De-risking” allows for a shift in economic relations and provides for a more neutral depiction of the relationship which does not characterize the interaction as a zero-sum game.
It's crucial to understand that de-risking isn’t solely a U.S. initiative even though the U.S. has enacted the following: tariffs, sanctions on select Chinese companies, limits on advanced technology and component exports to China, the Indo-Pacific Economic Framework (IPEF), AUKUS, CHIPS1 and Science Act, CHIP 4 Alliance, the U.S.-Japan-South Korea trilateral summit, and more. For China, depending on the West for crucial technology, components for its value chains, and on dollars for international trade and finance poses risks, especially in conflict situations. Consequently, China is also pursuing de-risking strategies to reduce dependence on U.S. technology and a dollar-centric financial system, including the SWIFT payments mechanism.
Over the last six months, the trajectories of the U.S. and Chinese economies have diverged. Amidst persistent recession warnings by some economists, the U.S. economy continues to grow and the employment data reveal no sign of a downturn. How will U.S. interest rates evolve in 2023/2024? Should one brace for a 2024 recession in the U.S.? China’s economy continues to face one challenge after another. The official Chinese data indicates a sharp slowdown in economic growth — a “growth recession.” Is this masking an actual recession? Is China’s current property market problems similar to Japan in the 1990s, leading to China beginning to experience a “lost decade”, or perhaps even longer? Might China now encounter its own “Lehman moment,” reminiscent of the U.S. 2008 financial crisis? Our report delves into these pressing questions.
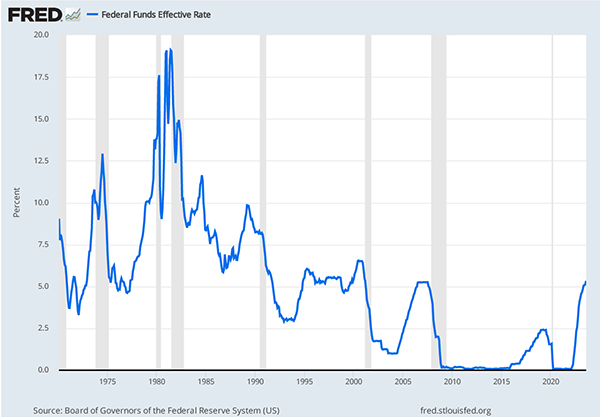
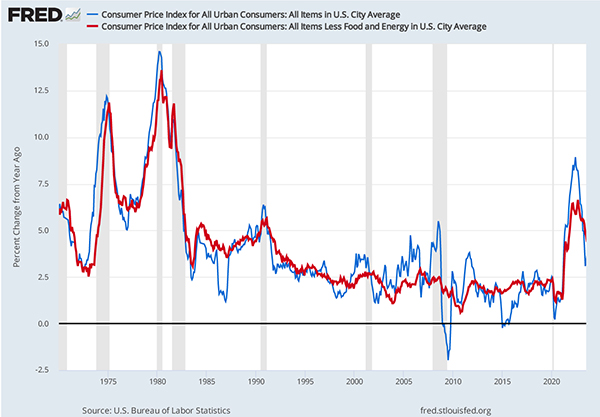
To combat inflation, the Federal Reserve swiftly increased Federal Funds rates from 0% in March 2022 to 5.3% in July 2023 (Figure 1). The interest rate is now on par with levels seen prior to the Great Recession. Headline inflation (Figure 2) declined significantly from 8.9% in June 2022 to 3.3% in July 2023. But core inflation remains at elevated levels — 4.7%.
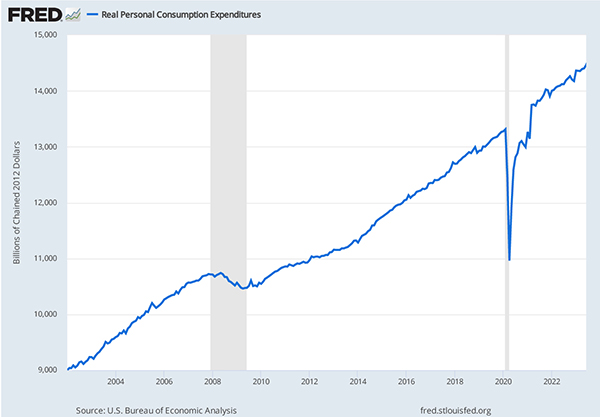
With the interest rate hikes and the ongoing inverted yield curves, we grew concerned about the potential onset of a downturn. However, employment statistics over the past year have shown no such indications. Monthly nonfarm payroll jobs have been increased by 190,000 per month on average over the past six months. Unemployment rates have stayed low and job openings reached notable highs, such as 8.8 million openings last July. Furthermore, real personal consumption expenditures, 2/3 of GDP demand, continue to trend upward robustly (Figure 3).
Despite 10-year Treasury rates climbing to 4.3% — the highest level since 2008 — and 30-year mortgage rates hitting 7.1%, a peak not seen since 2002, housing markets remain resilient. The S&P/Case-Shiller home prices began to rebound in January 2023, following a modest 5% decline for the 20-City Index and a 3% drop for the National Index from their highs in June 2022. New home sales, along with housing starts, have found stability in recent months after some slight adjustments. Why haven’t these rising and elevated interest rates caused a deeper downturn in the housing market?
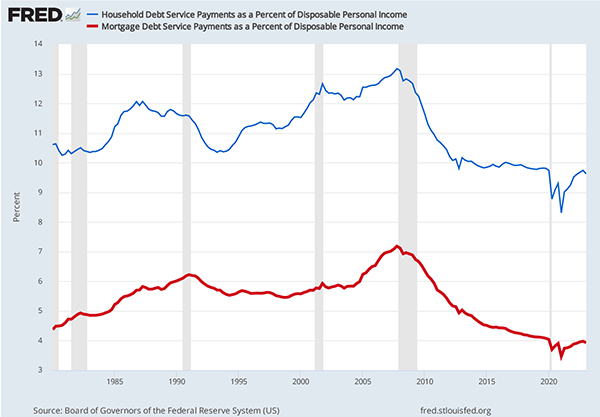
First, as mentioned in our previous reports, there hasn’t been significant overinvestment or overborrowing in residential real estate over the past decade. Thus, the fundamentals of the housing market lend support to the stability of prices and supply in the face of high interest and mortgage rates. Figure 4 displays the household debt and mortgage debt service payments as a percentage of disposable personal income. Contrary to the three years leading up to the 2008 financial crisis, American households’ current debt burdens are relatively low. This is in part due to caution derived from the harsh lessons of the housing bubble burst and the subsequent financial crisis of 2008.
Does this imply the U.S. has successfully navigated to a soft landing characterized by falling inflation without significantly higher unemployment? Increasingly, this looks to be the case, although the growth for 2024 is expected to be weak. At the Jackson Hole symposium in August 2023, the Federal Reserve Chair Jerome Powell stated: “We are prepared to raise rates further if appropriate, and intend to hold policy at a restrictive level until we are confident that inflation is moving sustainably down toward our objective.” The Fed rightly acknowledges that inflation remains high and the aforementioned positive data suggests the economy is not cooling as anticipated. In essence, the restrictive monetary policy will persist, if not more, until a 2% inflation is realized. Of course, policymakers are not bound by this statement and a continued decline in inflation rates could lead to some financial easing in the coming year.
China’s GDP grew by 5.5% in the first half of 2023 compared to the same period in 2022, as reported by its National Bureau of Statistics (NBS). Given a lower base in 2022 due to China’s stringent Zero-Covid policy, Wall Street expected a post-pandemic boom in China with much more rapid growth after China abandoned lockdown measures. The credibility and precision of the official statistics raise questions. The UCLA Anderson Forecast developed an alternative model to assess China’s GDP growth2. The model factors in the annual growth rates of four key variables. In the first six months of 2023, these were: energy consumption at 4.4%, CO2 emissions at 3.6%, total trade (combining exports and imports): -6%, and home price growth at -20%. Based on the Forecast’s model, China’s GDP growth rate for the first half of 2023 is estimated to be 1.8%, a figure considerably lower than the official Chinese estimate.
Figure 5 presents a comparison between our model’s estimation of China’s historical GDP (red line) and the NBS’ official figures (blue line). It is evident that our estimates exhibit consistently lower growth rates compared to the official statistics. It is important to note that our calculations factor in a -20% growth rate for Chinese housing prices in 2023. This assumption stems from the myriad of challenges witnessed in China’s real estate sector, including issues related to its largest developers Evergrande and Country Garden. However, if we consider China’s official 70-city average growth rate3 of -1%, our model projects China’s GDP growth to be 3.7%. For those holding a more bearish perspective on China’s property market, considering a -50% of housing price growth, our model suggests a GDP growth rate of -0.9%. In other words, China may already be in a recession. A telling indicator of the struggles in China’s property market is the performance of representative real estate ETFs from both the U.S. and China. Between January 2021 and August 2023, the Vanguard U.S. real estate ETF (VNQ) appreciated by 10%, while the MSCI China Real Estate ETF (CHIR) has declined by 56%.
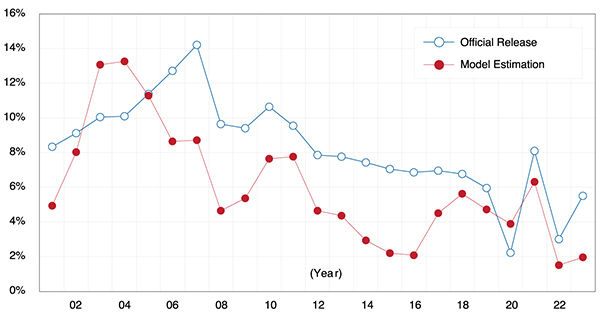
Figure 5 illustrates a downward trajectory in China’s GDP growth, as reflected in official statistics and our model estimates. It is not uncommon to observe a deceleration in growth rates as nations become wealthier. However, China’s many years of high investment, especially in the real estate sector, have led to overinvestment and economic imbalances. Consequently, a massive real estate bubble and soaring debt have been made. The Bank for International Settlements (BIS) estimates4 that China’s total debt of the non-financial sector reached 297% of its GDP in 2022 Q4 compared to G20’s 249%. With this bubble now bursting, the substantial debt is poised to weigh on China’s economy for the coming decade or even longer. Some analysts suggest that China might be echoing Japan’s “Lost Decades” of the 1990s and 2000s, noting parallels in the causes and effects of their respective bubble economies.
Figure 6 shows the investment (gross fixed capital formation) as a percentage of GDP for the U.S., China and Japan. While the average for investments in real estate, infrastructure, and factories hovers around 23% of its economy, China’s investment has consistently been above 30% of its GDP for the past two decades. Such disproportionate investments result in misallocated resources, diminishing or even negative returns, and escalating debts. This pattern mirrors Japan’s experience in the 1970s and 1980s, which was subsequently followed by its “lost decades” as its bubble deflated. We use the line with circle to show how investment boom in Japan in the 1970s and 1980s paralleled the 2000s and 2010s in China.
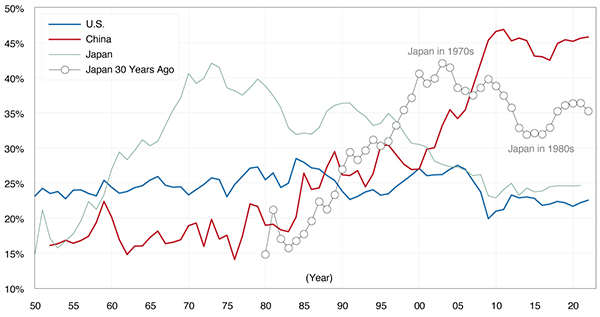
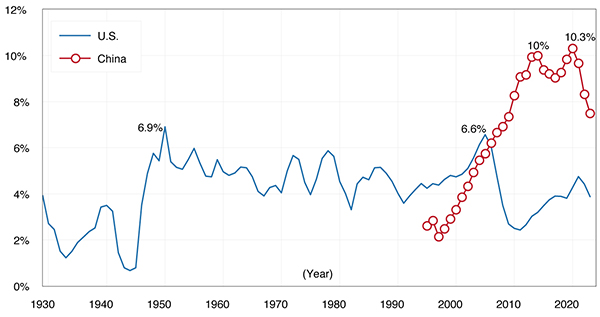
Figure 7 illustrates the magnitude of China’s housing bubble. The graph shows the annual direct residential investment as a percentage of GDP for the U.S. and China, with data available post-1995. During the Great Depression and World War II, the U.S. saw less than 2% of housing investment. On average, the U.S. had housing investment averaging about 4.5% of its GDP over the past century. Only twice did it exceed 6%: once in 1950 at 6.9% and again in 2004-2006, peaking at 6.6%, just before its housing market crash. While there are distinct differences in housing markets between the U.S. and China, such as urbanization, we arbitrarily assume the 6% mark as an indicator threshold for a housing bubble. By this measure, China’s housing market has been over-invested since 2006.
To grasp the scale of China’s construction boom, let’s compare it to the average annual construction in the U.S.: approximately 4 billion square feet (1 billion commercial and 3 billion residential). Since 2007, China’s construction has exceeded 20 billion square feet every year, but this number surpassed 40 billion annually from 2013 onwards. In 2022, in addition to completing 43.6 billion square feet, there was astounding 168 billion square feet still under construction. Note that, in Figure 6, 2006 is also the year that its investment share of GDP surpassed 35%. Drawing parallels from U.S. and Japan history, a severe housing bubble is typically followed by an equally severe housing downturn. This suggests China might face a two-decade slump in its housing market. Therefore, it is reasonable to posit that China is entering a prolonged period of stagnation, if not worse, as it grapples with massive overinvestment and debts.
Note that due to the tight control of the Beijing government, the likelihood of a “Lehman Moment” — a full-scale financial meltdown and crisis — occurring in China is relatively low. Entities associated with the real estate bubble deemed “To Big to Fail” or “Too Connected to Fail”, whether they are developers, lenders, or banks, are likely to receive support, undergo restructuring, or be salvaged to various extents in the following years.
At the beginning of this report, we discussed the background of the U.S.-China decoupling and the more recent shift towards de-risking. This section presents some evidence to support those observations. Foreign direct investment (FDI) represents multinational corporations’ confidence in a country’s economic growth, market potential, and production capabilities. In 2022, U.S. net FDI inflows amounted to $352 billion, making it the largest recipient country. China was second with $180 billion. However, when evaluating FDI net inflows as a percentage of GDP, there is a decreasing trend for China not apparent for other countries (Figure 8). In 2022, China’s share of FDI net inflow (1%) lagged behind that of other major economies. This can be attributed to rising labor costs, a slowing economy, and increasing risks associated with doing business in the country. During her visit to China in August 2023, U.S. Commerce Secretary Raimondo warned that U.S. businesses might stop investing in China due to worsening conditions, such as raids on firms, unexplained fines, unpredictable regulations and official behaviors, and an unlevel playing field.
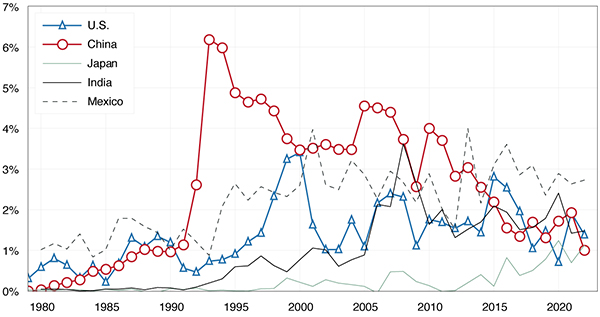
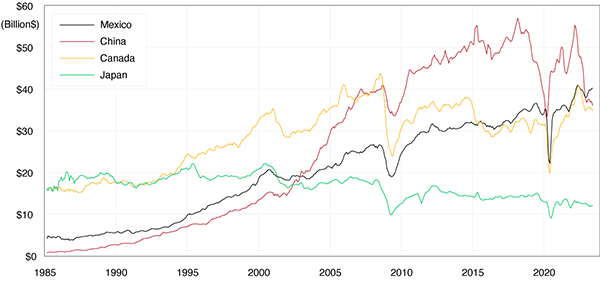
Building on our previous discussions about the reshaping of global supply chains and the shift away from China-centric models, there has been a noticeable decline5 in the share of U.S. imports of goods from China in 2018. The latest data from 2023 further underscores this ongoing trend. Figure 9 displays the U.S. monthly real goods imports6 from key trading partners. From October 2008 to November 2022, China was the predominant source of U.S. goods imports. Since then, Mexico has taken the lead as the U.S.’s top importing partner. Nearshoring in Mexico has been driven by the early U.S.-Mexico-Canada Agreement (USMCA), the recent CHIPS Act, and the Inflation Reduction Act (IRA), all of which incentivize manufacturing within North America.
Given our forecast of a slowing Chinese economy — caused by its real estate woes and the reshaping supply chains, potentially trapped into a recession already and followed by two decades of stagnation — how might this influence global economies? While we will discuss the ramifications of FDI and foreign portfolio investment in China in future reports, this edition will focus on the impact of goods trade, especially for economies that predominantly export to China. If a nation’s economic growth heavily relies on its goods exports to China, a slowing Chinese economy will invariably dampen the nation’s exports and potential for its broader economic growth.
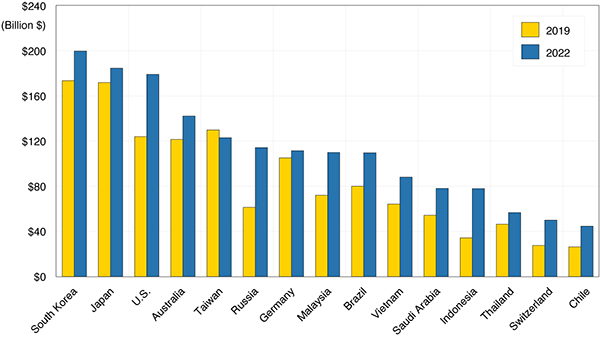
Figure 10 displays the nominal goods exports to China from the top 15 exporting economies in both 2019 and 2022. In 2022, South Korea led with exports worth $200 billion, followed by Japan’s $184 billion, the U.S.’s $179 billion, Australia’s $142 billion, Taiwan’s $123 billion, and Russia’s $114 billion. Of these, South Korea, Japan, and Taiwan export electronic, computer, and semiconductor components to China for further assembly and processing. Australia exports industrial and agricultural commodities, Russia and Saudi Arabia are major energy exporters, while the U.S. ships a mix, including aircraft.
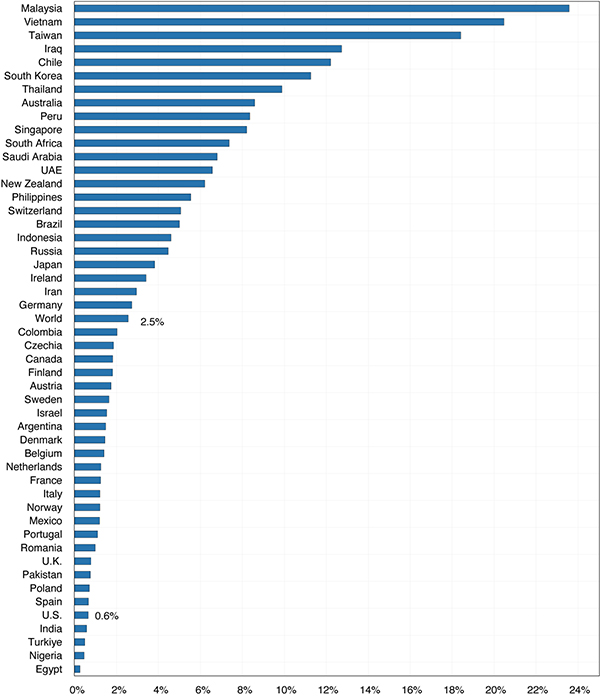
While Figure 10 provides a snapshot of major exporters’ total exports to China, it doesn’t reveal the proportional impact on each exporter’s economy due to varying economic sizes. To gauge this impact more clearly, we consider the average goods exported to China as a percentage of the exporter’s average GDP for both 2019 and 2022. This ratio serves as a barometer of each economy’s trade exposure to China. Figure 11 examines the 50 largest global economies and ranks them by this exposure metric. The distribution of this risk is far from uniform. Malaysia tops the list with a risk of 24%, trailed by Vietnam (20%), Taiwan (18%), Iraq (13%), and Chile (12%). The global average is 2.5%. The U.S., in comparison, has total goods exports to China representing a mere 0.6% of its GDP. Consequently, the U.S. economy is much less exposed to a slowing or recession Chinese economy.
For economies exporting goods to China primarily for further processing and assembly — which are then shipped globally — the export risk can be mitigated by diversifying their supply chains. This not only reduces dependency on an unstable Chinese economy but also boosts supply chain resilience, and curtails national security risks, in particular in sectors like computing, communications, and semiconductors. Figure 10 shows that Taiwan has begun making these adjustments. With the U.S.-led de-risking policies, countries such as Japan and South Korea are likely to follow suit.
This is a time of change in U.S. / China economic relations. After six years of disengagement, the two countries are in discussions to find areas for future cooperation. Slow to negative growth in China will add pressure on Beijing in these negotiations while at the same time increasing geopolitical risks. While U.S. manufacturers are remaking supply chains, particularly for products deemed important for the U.S. economy and security, the vast majority of imports from China are consumer goods and these will continue to flow. The reduction in demand for U.S. goods by China, while important for those exporters, is small and ought not to have a significant impact on U.S. growth. Indeed, the resumption of aircraft exports by Boeing to Chinese airlines can substantially mitigate the impact.
Cathay Bank has commissioned UCLA Anderson Forecast to produce a U.S.-China Economic Report series that focuses on current topics affecting investment flows and associated economic events between China and the United States.
UCLA Anderson Forecast has been the leading independent economic forecast of both the U.S. and California economies for 70 years.
This report includes forecasts, projections, and other predictive statements that represent UCLA Anderson Forecast’s economic analysis and perspective on the current state and future outlook of the United States and China economies based on the available information. These forecasts take into account industry trends and other factors and involve risks, variables, and uncertainties. This information is given in summary form and does not purport to be complete. Information contained in this report should not be considered advice or recommendation for a particular course of action and does not take into account any particular business objectives, financial situation, or needs.
Readers are cautioned not to place undue reliance on the forward-looking statements. UCLA Anderson Forecast does not undertake any obligation to publicly release the result of any revisions to these forward-looking statements after the date of this report. While due care has been used in the preparation of the forecast information, actual results may vary in a materially positive or negative way. Forecasts and hypothetical examples are subject to uncertainty and contingencies beyond the control of UCLA Anderson Forecast.
Jerry Nickelsburg joined UCLA’s Anderson School of Management and The Anderson Forecast in 2006. Since 2017 he has been the Director of The Anderson Forecast. He teaches economics in the MBA program with a focus on Business Forecasting and Asian economies. He has a Ph.D. in economics from the University of Minnesota and studied at The Virginia Military Institute and George Washington University. He is widely published and cited on economics and public policy.
William Yu joined the UCLA Anderson Forecast in 2011 as an economist. He focuses on economic modeling, forecasting, and the Los Angeles economy. He also researches and forecasts on China’s economy and its relationship with the U.S. economy. His research interests include various economic and financial issues, such as time series econometrics, data analytics, stock, bond, real estate, commodity price dynamics, human capital, and innovation.

