
Over the past seven years, U.S.-China relations have been on a downward trajectory. Amid concerns about how much further this relationship could deteriorate, President Biden and President Xi convened in San Francisco in November 2023. This meeting marked a significant halt, if not a reversal, of the escalating tensions. The question arises: What averted the progression from strategic competition to a full-blown rivalry between these two great powers?
We suggest two main factors. First, from China's perspective, there might have been a realization that the Chinese economy is not as resilient as Beijing previously believed. Following the global financial crisis of 2008, Beijing had been under the impression that its centrally controlled economy model would generate superior economic growth compared to Western economies. The COVID-19 pandemic, which significantly disrupted the U.S. and the West in 2020 and 2021 and caused relatively less damage in China during the same years, bolstered Beijing's confidence. Beijing's narrative that "the East is rising and the West is declining" gained traction. However, the Zero COVID policy implemented in China in 2022 exposed bigger vulnerabilities in China's economy that have now led to economic stagnation. Recognizing these challenges and the need to stabilize its economy, Beijing may now see less merit in directly challenging U.S. leadership.
Second, from the U.S. perspective, the unforeseen and unwelcome occurrences of the Russia-Ukraine War that began in February 2022 and the Israel-Hamas War that began in October 2023 heightened the U.S.'s aversion to conflict in the Asia Pacific region. Consequently, the U.S. sought a more conciliatory and friendly approach toward China to avoid further conflict. The meeting in San Francisco successfully lowered the temperature, achieving progress in areas such as resuming military communications and combatting illicit drugs.
Over the last six months, the economic paths of the U.S. and China have increasingly diverged. Despite ongoing recession warnings, the U.S. economy has shown resilience and superior economic growth, and current job data indicates there is further room to grow in 2024 and 2025. Given the strong economy and sticky inflation, what is the future direction of U.S. inflation and interest rates for the balance of 2024? Conversely, China's economy has encountered multiple challenges. Will Beijing be able to implement effective policies to revive its weakening economy soon? Additionally, how are international trade, investment, and global supply chains evolving in an era of de-risking? Our report explores these urgent questions in detail.
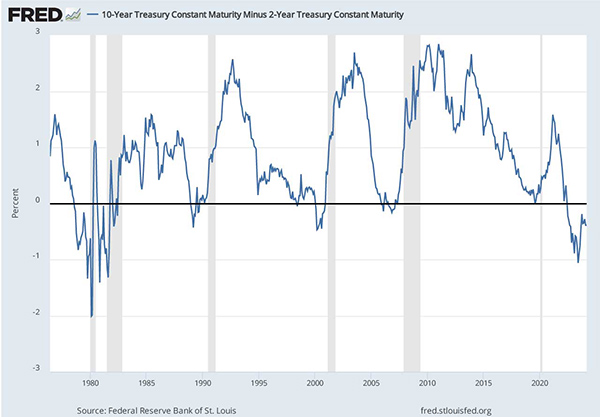
Over the past five decades in the U.S., when the Federal Reserve increased interest rates to curtail inflation and cool an overheating economy, it often has led to a recession, especially when accompanied by an inverted yield curve (Figure 1). However, the current cycle of monetary tightening seems different, and a near-term recession is not expected. Why is this time different? While the reasons include unclear factors related to Treasury market practices and financial markets, we explore real economic factors.
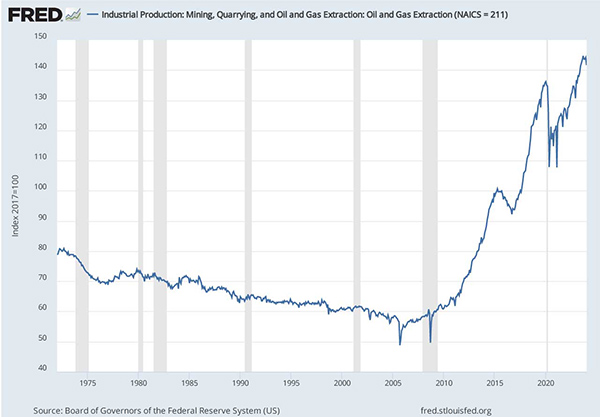
First, the U.S. is benefiting from a resurgence in shale oil and gas production thanks to advanced fracking technology. Disrupted during the COVID-19 pandemic, U.S. oil and natural gas production has now hit record highs (Figure 2). It might be surprising to some that the U.S. is now the world's largest producer of both oil and natural gas. This increase in supply is critical in staving off a repeat of stagflation from the 1970s. A similar negative supply shock to the 70’s that occurred when Russia invaded Ukraine in 2022 and sanctions on Russian oil and gas were placed by the West was accompanied by higher energy production; production that has stabilized gasoline prices and countered supply constraints inflation pressures.
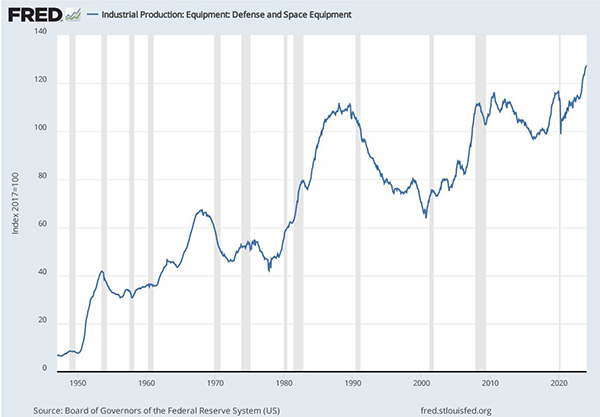
Second, conflicts in Ukraine and the Gaza Strip have spurred a rapid increase in U.S. military and defense equipment production over the past six months, reaching historic highs (Figure 3). This surge has boosted U.S. GDP, with federal defense spending year-over-year growth rising from around 0% in 2021/2022 to 7% in 2023.
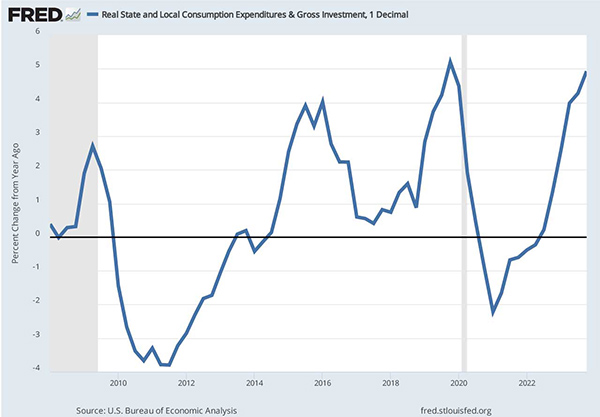
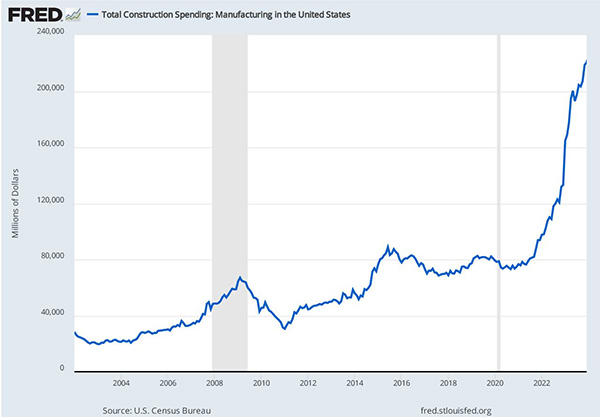
Third, major bills passed in 2021 and 2022, including the Infrastructure Investment and Jobs Act (IIJA) of 2021, CHIPS and Science Act of 2022, and Inflation Reduction Act (IRA) of 2022, have generated simulative fiscal spending and rejuvenated U.S. manufacturing and supply chain resilience. The impact is seen in the year-over-year growth of state and local government consumption and investment, which has increased by 4% (Figure 4). There has also been a significant rise in manufacturing sector construction ($120 billion over the past year), offsetting the decline in residential construction investment from pandemic highs as a consequence of reduced migration and higher mortgage interest rates (Figure 5).
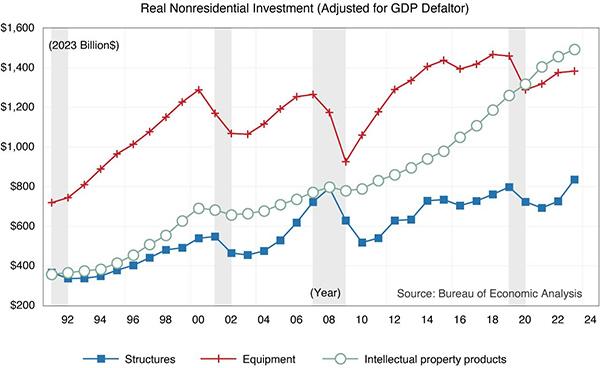
Finally, in spite of widely publicized tech layoffs, we cannot forget about the importance of AI tech company growth and, more generally, the continued growth of the tech sector, both of which have driven stock markets to record highs. Figure 6 shows three major components of real nonresidential investment, adjusted for inflation by the GDP deflator (2023 billion dollars). As we mentioned earlier, unlike previous tightening cycles in 2000 and 2008, we did not see a decline in aggregate capital investment in equipment (red line) and structures (blue line). Furthermore, we see continued growth in investment in software and intellectual property products (green line). Note that this component, which is less interest sensitive, has become the largest element in nonresidential investment.
We observe that these factors are important components propelling a resilient U.S. economy and are likely to remain positive in the near future. Moreover, significant AI investments are expected to enhance productivity in the future. Looking forward, we forecast a steady 2.5% trend in economic growth. With inflation remaining above 2% and the economy growing at its potential, we predict the Fed will maintain short-term interest rates well above 4% in 2024.
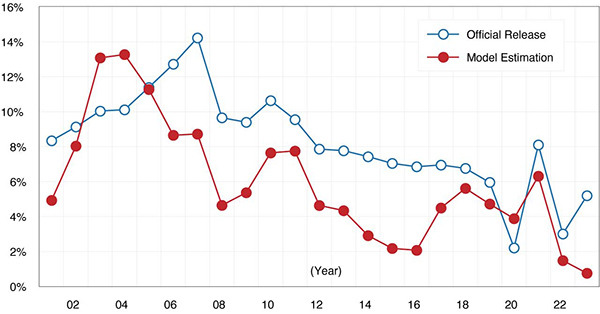
Despite widespread negative news about China’s economy last year, including flat consumer demand, weak manufacturing, and a steep decline in residential construction, the Chinese government reported a 5.2% growth in GDP for 2023. This figure sharply contrasts with the prevailing perception, casting doubt on the accuracy of China's official statistics. Indeed, any Western economy exhibiting these characteristics would almost assuredly be in a recession. The UCLA Anderson Forecast has developed a straightforward alternative model to assess China’s GDP growth1. The model factors in the annual growth rates of four key variables. In 2023, these were: energy consumption estimated at 4.3%, CO2 emissions at 2.5%, total trade (combining exports and imports) at -5.3%, and home price growth at -30%. Based on the Forecast’s model, China’s GDP growth rate for 2023 is estimated to have been 0.8%, a figure considerably lower than the official Chinese estimate, and given forecast error, not significantly different from 0.0%.
Figure 7 presents a comparison between our model’s estimates of China’s historical GDP (red line) and the NBS’ official figures (blue line). It is evident that our estimates exhibit consistently lower growth rates compared to the official statistics. It is important to note that our model incorporates a -30% rate for Chinese home prices in 2023, reflecting the turmoil in China's property sector, with major developers like Evergrande facing liquidation and Country Garden confronting a liquidation petition. However, if we consider China’s official 70-city average home price declines of -4% as representative of the country, our model projects China’s GDP growth to be 3.1%. While the 4% decline might be accurate, it does not reflect the underlying market price. Rather, intervention on the part of the government to prop up failing real estate firms and to keep housing units off the market mask what would otherwise be a steep price decline.
The plight of China's real estate market is highlighted by comparing real estate ETFs from the U.S. and China. For instance, in 2022 and 2023, the Vanguard U.S. Real Estate ETF (VNQ) saw growth rates of -21% and +7%, respectively, whereas the MSCI China Real Estate ETF (CHIR) experienced declines of -30% and -37%.
Figure 8 illustrates the scale of China’s housing bubble and subsequent bursts. The graph shows the annual direct residential investment as a percentage of GDP for the U.S. and China, with data available post-1995. The U.S. has historically seen housing investment average around 4.5% of its GDP (dashed line) over the last century, exceeding 6% only in 1950 (6.9%) and during 2004-2006 (peaking at 6.6%) prior to its housing market crash. While there are distinct differences in housing markets between the U.S. and China, such as recent urbanization in China, we arbitrarily assume the 6% mark as an indicator threshold for a housing bubble. By this measure, China’s housing market has been over-invested since 2006. Considering the average housing unit size in China as 80 square meters, the country has been constructing over 8 million units annually since 2011. By December 2023, there were still 73 million housing units under construction in China.
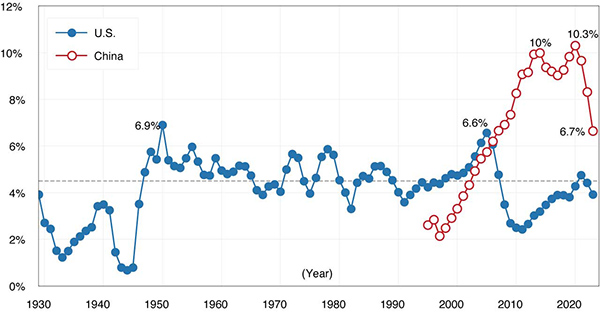
In the initial three years of the U.S. housing bubble's burst (2006-2008), the housing investment share of GDP fell by 3.1 percentage points (from 6.6% to 3.5%). A similar pattern is observed in China’s property market crash, with housing investment as a percentage of GDP dropping by 3.6 percentage points (from 10.3% in 2020 to 6.7% in 2023) and housing starts measured by square meters falling by 58% from their 2019 peak. On a current U.S. Dollar basis, this represents a 22% decline, and on a Purchasing Power Parity basis, an 11.7% decline. For the U.S., declines of this magnitude were associated with a recession six times in the last 80 years, and only twice were not.
One of the two exceptions was in 1966 when an 11% growth in real defense spending was on a base of 9.6% of GDP, a buildup for the Vietnam War. China is projected to increase defense spending by 7.2% on a base of 1.6% of GDP for a considerably smaller demand impact on the economy. The second was the end of 2006, and the collapse of housing construction culminated in the Great Recession at the beginning of 2008. The current level of residential investment in China remains high, suggesting further potential for decline as in the 2006 U.S. case. These data and the decrease in the Chinese population do not bode well for a resolution of China’s housing crisis without very slow to negative growth.
In contrast to stock market crashes, the housing sector is heavily reliant on debt, with developers and homebuyers often securing financing through loans and leverage. As housing prices fall, the value on one side of the balance sheet decreases, while the nominal debt remains unchanged on the other side. This imbalance causes difficulties for both borrowers and lenders in maintaining solvency or restoring their financial health. Consequently, even in a low-interest-rate environment, households, firms, local governments, and banks become hesitant to engage in new borrowing or lending activities. Following the burst of their real estate bubbles, it took Japan nearly 30 years and the U.S. about eight years to recover financially. We predict China needs a recovery period ranging somewhere in the middle, perhaps from 10 to 20 years.
The question arises: Can the Beijing government intervene and rekindle its growth, as it has in the past? This time, the outlook appears doubtful. Since the 2008 global financial crisis, Beijing has relied on fiscal stimulus to invigorate its slowing economy, notably during 2008/2009, 2011/2012, and 2016-2020. These interventions have led to an increasingly large property bubble, an expanded infrastructure network, and overcapacity in manufacturing facilities.
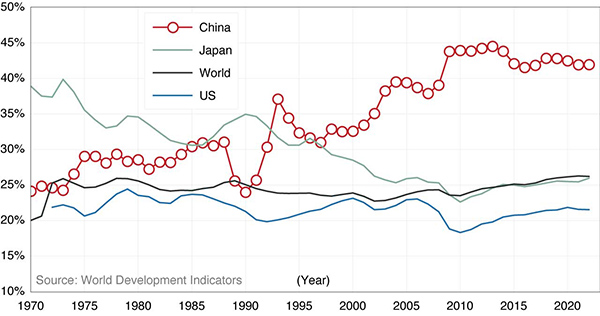
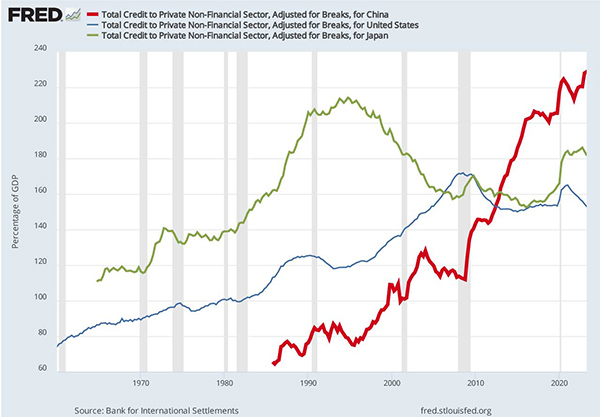
Figure 9 illustrates the investment (gross fixed capital formation) as a percentage of GDP for the U.S., China, Japan, and the world. While the global average for investments in real estate, infrastructure, and factories is around 25%, China's investment rate has consistently exceeded 35% of its GDP since 2002 and surpassed 40% after 2008. Such disproportionate levels of investment lead to misallocated resources, diminishing, or even negative, returns, and escalating debt burdens. China’s pattern of overinvestment is even more severe than Japan’s experience in the 1970s and 1980s, both in scale and duration. Figure 10 shows that China's persistent and extensive overinvestment has accelerated its private-sector debt accumulation since 2008, reaching 228% of GDP in 2023. Including government debt, China’s debt-to-GDP ratio escalates to 307%, significantly higher than the U.S.'s 253% and the G20 average of 248%. In summary, China's continual investment, despite the likelihood of negative returns and escalating debt, is unsustainable.
In our previous reports, we discussed the dynamics of U.S.-China strategic competition and subsequent de-risking. This report presents evidence of the ongoing transformation of global supply chains and the move away from a China-centric trade model. Figure 11 highlights this shift: in 2016 (prior to the U.S.-China trade war), China was the primary import source for the U.S., accounting for 21% of import value. By 2023, this figure has dropped to 14%, a decline of 7.3 percentage points. Conversely, imports from Mexico have risen by two percentage points from 2016 to 2023. Now, under the principles of near-shoring and the USMCA agreement, Mexico has emerged as the largest import source for the U.S. The reduction in dependence on China, coupled with existing tariffs, has led to a diversification of import sources to other countries like Canada (with a 1% increase from 2016 to 2023), South Korea (+0.6%), Vietnam (+1.8%), Taiwan (+1.1%), and India (+0.6%). This strategy, commonly referred to as “friend-shoring,” is a real and ongoing process. From the Chinese side, there is an official move to replace Western software, inclusive of operating systems and applications, with domestically created software. This will accelerate the reduction in foreign direct investment and trade in services between China and the West.
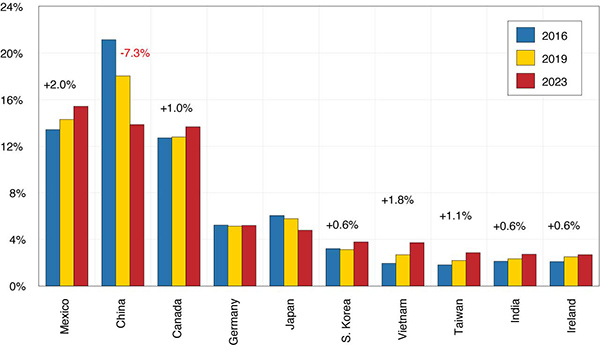
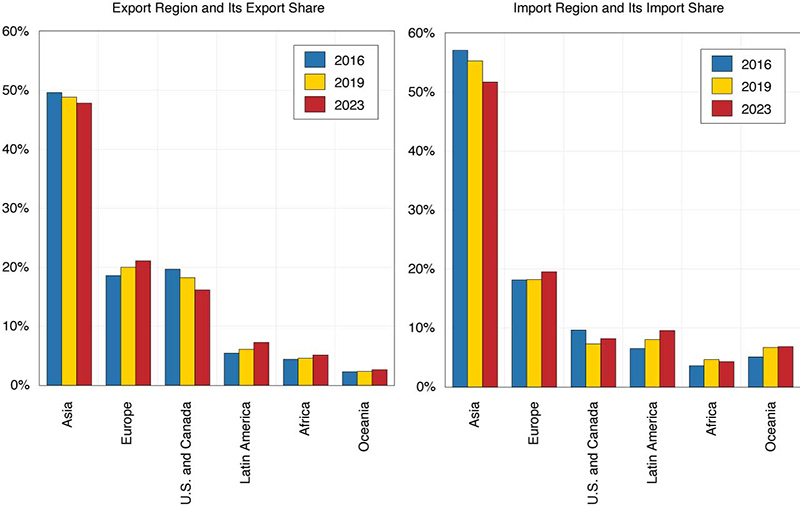
Figure 12 provides insight into the changes in China’s export and import regions, along with their respective shares in 2016, 2019, and 2023. Despite a decrease in China’s export share to the U.S., the U.S. remains China’s most significant export market and the primary source of its trade surplus. Currently, China is actively seeking to boost its exports to Europe, Latin America, and Africa. Trade tensions are poised to escalate in the future due to an overproduction of goods in China. This is particularly acute in the electric vehicle (EV) and solar panel sectors, which exceed the absorption capacity of the domestic market. As a case in point, the European Commission is probing potential unfair advantages associated with the cheaper Chinese-made EVs attributable to state subsidies to determine whether or not to impose retaliatory tariffs.
Though not shown in the chart, China's import share from Russia showed a substantial increase, rising from 2.9% in 2019 to 5.1% in 2023. Similarly, China's exports to Russia escalated from 2% to 3.3%. As Russia faced Western sanctions due to its invasion of Ukraine, China has augmented energy imports from Russia and increased exports of goods and equipment. With no end to the sanctions on Russia in sight, this shift in Chinese trade is expected to continue.
In summary, China's economy faces three major structural challenges. First, the consequences of overinvestment and the bursting of the real estate bubble are deep-rooted issues that will require a prolonged period to resolve. Second, the intensifying strategic competition between the U.S. and China limits China's access to advanced Western technology. This tension has contributed to a noticeable decline in Foreign Direct Investment in China, with many manufacturers moving their operations elsewhere. Third, under President Xi's rule, there has been a shift towards a more state-controlled economic model. This shift, combined with the uncertainties in Beijing's policy, regulatory, and control measures, is causing businesses, individuals, and capital to become wary and increasingly relocate outside China. These challenges are not just short-term or cyclical; they are indicative of a potentially bleak economic outlook for China in the next decade.
In the 40-year period following World War II, Japan’s economic growth was characterized as a miracle of planning. It was fueled primarily by a high savings rate supporting large investments in modern capital goods. At some point, the returns on these investments fell, and the savings went into a real estate bubble. After the bubble burst, Japan found itself with slow growth in what has since been dubbed the “lost decade2.” Today, China finds itself in a similar place. From the mid-1980s a high savings rate has fueled a remarkable period of economic growth. Falling returns to investment, a real estate bubble, and a declining population are strikingly similar. For the decade of the 2020s to be other than a lost decade, China must find a way to spur innovation and growth despite having fewer economic ties with the countries that brought it prosperity through export-led growth, including the U.S. The U.S. economy is leading the developed world in economic growth even as it decouples from China. As the gap widens and China feels increasingly isolated from the West3, the new reality of economic opportunities will impinge on investment and trade between the two.
Cathay Bank has commissioned UCLA Anderson Forecast to produce a U.S.-China Economic Report series that focuses on current topics affecting investment flows and associated economic events between China and the United States.
UCLA Anderson Forecast has been the leading independent economic forecast of both the U.S. and California economies for 70 years.
This report includes forecasts, projections, and other predictive statements that represent UCLA Anderson Forecast’s economic analysis and perspective on the current state and future outlook of the United States and China economies based on the available information. These forecasts take into account industry trends and other factors and involve risks, variables, and uncertainties. This information is given in summary form and does not purport to be complete. Information contained in this report should not be considered advice or recommendation for a particular course of action and does not take into account any particular business objectives, financial situation, or needs.
Readers are cautioned not to place undue reliance on the forward-looking statements. UCLA Anderson Forecast does not undertake any obligation to publicly release the result of any revisions to these forward-looking statements after the date of this report. While due care has been used in the preparation of the forecast information, actual results may vary in a materially positive or negative way. Forecasts and hypothetical examples are subject to uncertainty and contingencies beyond the control of UCLA Anderson Forecast.
Jerry Nickelsburg joined UCLA’s Anderson School of Management and The Anderson Forecast in 2006. Since 2017 he has been the Director of The Anderson Forecast. He teaches economics in the MBA program with a focus on Business Forecasting and Asian economies. He has a Ph.D. in economics from the University of Minnesota and studied at The Virginia Military Institute and George Washington University. He is widely published and cited on economics and public policy.
William Yu joined the UCLA Anderson Forecast in 2011 as an economist. He focuses on economic modeling, forecasting, and the Los Angeles economy. He also researches and forecasts on China’s economy and its relationship with the U.S. economy. His research interests include various economic and financial issues, such as time series econometrics, data analytics, stock, bond, real estate, commodity price dynamics, human capital, and innovation.

